Unit Loads
Monetization provides three small-sized line graphs. These 3 line graphs are clickable.
The line graphs are for the following:
- Revenue
- Unit Load RPM
- Unit Loads
Unit Loads
Unit loads are the ad containers, both video, and display, Insticator loads across each of your pages for all products, including Full Ad Management, Commenting, and Trivia. For Commenting and Trivia, we count all ads associated with that product, regardless if it is a single ad or four ads, as a single until load. For example, if we load one ad on the right rail, two ads on top of commenting, and another two ads at the bottom of commenting, it would count as 2 unit loads.
Ad refreshes, fill rates, and viewability does not add to the total unit load count.
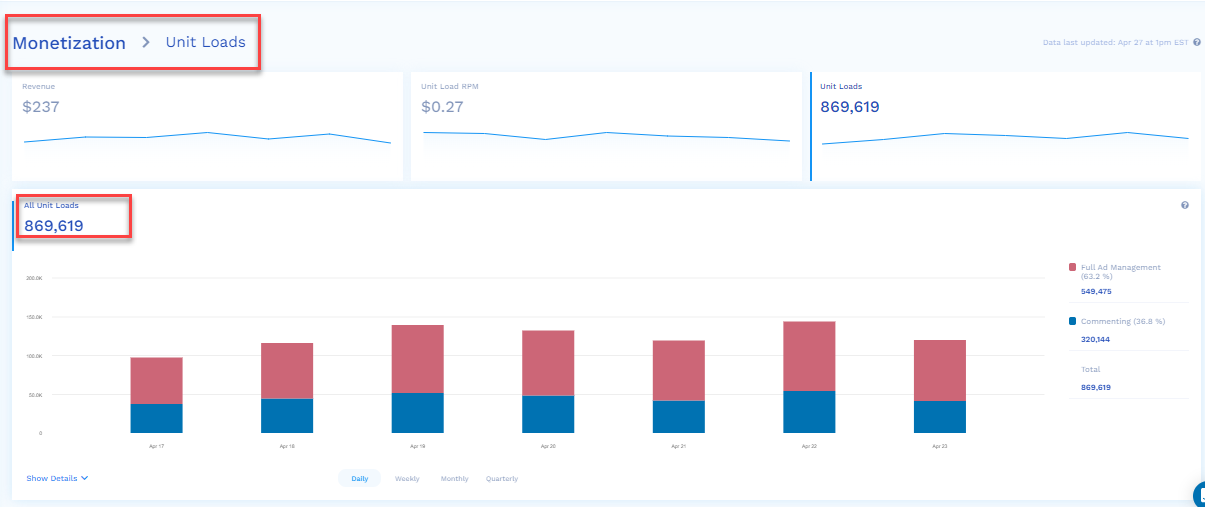
When you click the Unit Loads line graph, the total revenue for the selected date range is displayed as a bar graph in detail.
To view this page, you can also navigate from the left pane as Monetization > Unit Loads.
The features of the Revenue page are:
- The blue section of the graph is the total Unit Loads generated by the Commenting unit over the selected period of time (by default, it is seven days, and the maximum is 30 days).
- The red section of the graph is the total Unit Loads generated by the Full Ad Management unit over the selected period of time (by default, it is seven days, and the maximum is 30 days)
InformationThe image has 2 different products, Commenting and Trivia & Polls, hence red/blue is stacked on the graph. If you have only one Insticator product, you will just see one value in the table.
-
On the right side, you will see the following color-coded analytics for the selected period of time (by default, it is seven days, and the maximum is 30 days):
- Total Unit Loads of the Commenting unit
- Total Unit Loads of the Full Ad Management unit
- Total Unit Loads (Commenting + Full Ad Management)
-
The Show Details drop-down provides the Total Unit Loads analytics for each day in tabular format.
-
If you hover the mouse over each bar of the graph, the analytics for each bar/day is displayed on the right side of the graph.
Updated 8 months ago