Revenue
Monetization provides 3 small-sized line graphs. These 3 line graphs are clickable.
The line graphs are for the following:
- Revenue
- Unit Load RPM
- Unit Loads
Revenue
The shown revenue is your total net ad revenue, for the selected time period. Net revenue is your portion of revenue after fees and the negotiated Insticator portion of the revenue share.
Factors that can influence revenue are:
- CPM
- Site traffic
- Ad size and placement
- Display vs. video ads
- Ad fill rates
- Viewability of the ad
- Refresh rates
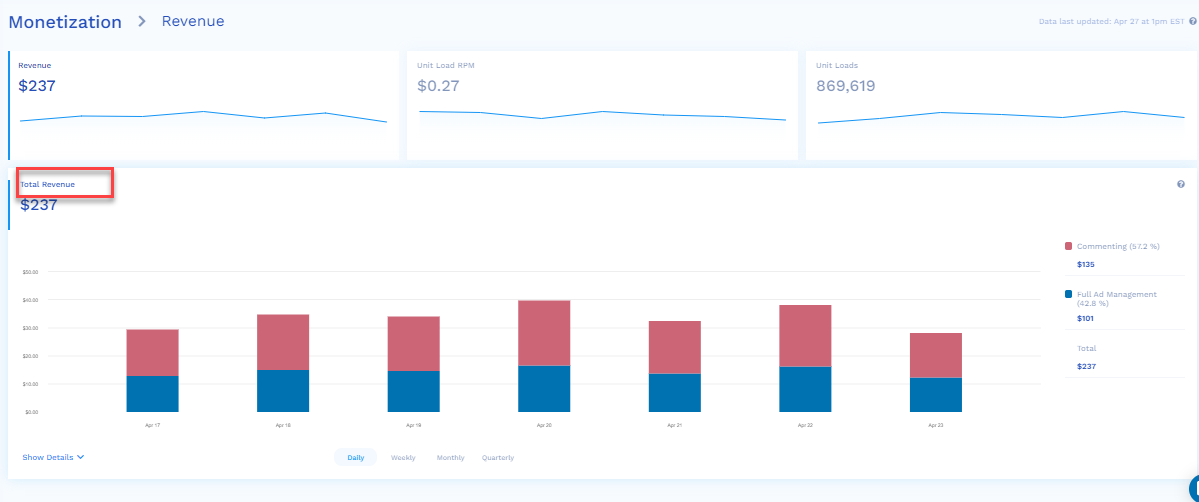
When you click the Revenue line graph, the total revenue for the selected date range is displayed as a bar graph in detail.
To view this page, you can also navigate from the left pane as Monetization > Revenue.
The features of the Revenue page are:
- The red section of the graph is the total revenue generated by the Commenting unit over the selected period of time (by default, it is seven days, and the maximum is 30 days).
- The blue section of the graph is the total revenue generated by the Full Ad Management unit over the selected period of time (by default, it is seven days, and the maximum is 30 days)
InformationIn this example the customer has 2 different products, Commenting and Trivia & Polls, hence red/blue is stacked on the graph. If you have only one Insticator product, you will just see one value in the table.
-
On the right side, you will see the following color-coded analytics for the selected period of time (by default, it is seven days, and the maximum is 30 days):
Total revenue generated by the Commenting unit
 Total revenue generated by the Full Ad Management unit
* Total revenue (Commenting + Full Ad Management) -
The Show Details drop-down provides the Total Revenue analytics for each day in tabular format.
-
If you hover the mouse over each bar of the graph, the analytics for each bar/day is displayed on the right side of the graph.
Updated 8 months ago