Engagement Products
Engagement Product reports and all of the metrics are inclusive of the following products:
- Commenting
- Trivia & Polls
Core Report Functionality
Basic Report Functionality
- If the user hovers over the bars in the graph, then the data within the table will be updated for that specific time frame (day, week, month, or quarter). To freeze that time period, click on the bar. Click again to unfreeze
- The data/metrics for each report can be broken down by a primary dimension and then user can further drill down into a secondary dimension
- Depending on calendar time range, users can roll-up data by day, week, month, or quarter
- Click on the "paint color chip" to hide/show that variable within the graph
- Hover over the table to select a variable within a dimension and then drill-down into that variable
- "Show Details" will expand the report to show a table of all the data used to create the graph. Click Export to download the data in the table via a CSV
- The availability of the roll-up periods are based on the global calendar filter as there are limits on how many periods can be shown within the graph. The maximum periods are: Daily (31 days), Weekly (52 weeks), Monthly (48 months), and Quarterly (48 quarters)
- As the roll-up periods or dimensions are changed, all reports will also be updated with those new settings
Reporting Dimensions
Each Monetization report supports Primary and Secondary dimensions. With the ability to drill-down two levels deep, users can better understand what is driving metrics and take advantage of opportunities or mitigate issues.
Primary Dimensions
Each report supports multiple dimensions that when selected will change the variables within the graph. The complete set of primary dimensions are below but some reports may have fewer because the dimensions aren't applicable:
- Product
- Site
- Country
- Device
- Ad Unit
- Revenue Type
Depending on the dimension, up to 7 variables will be shown wihtin the graph. If there are more than 7 variables in the data set, all others will be grouped into an "Other" bucket ensuring all data is captured and represented in the table & graph.
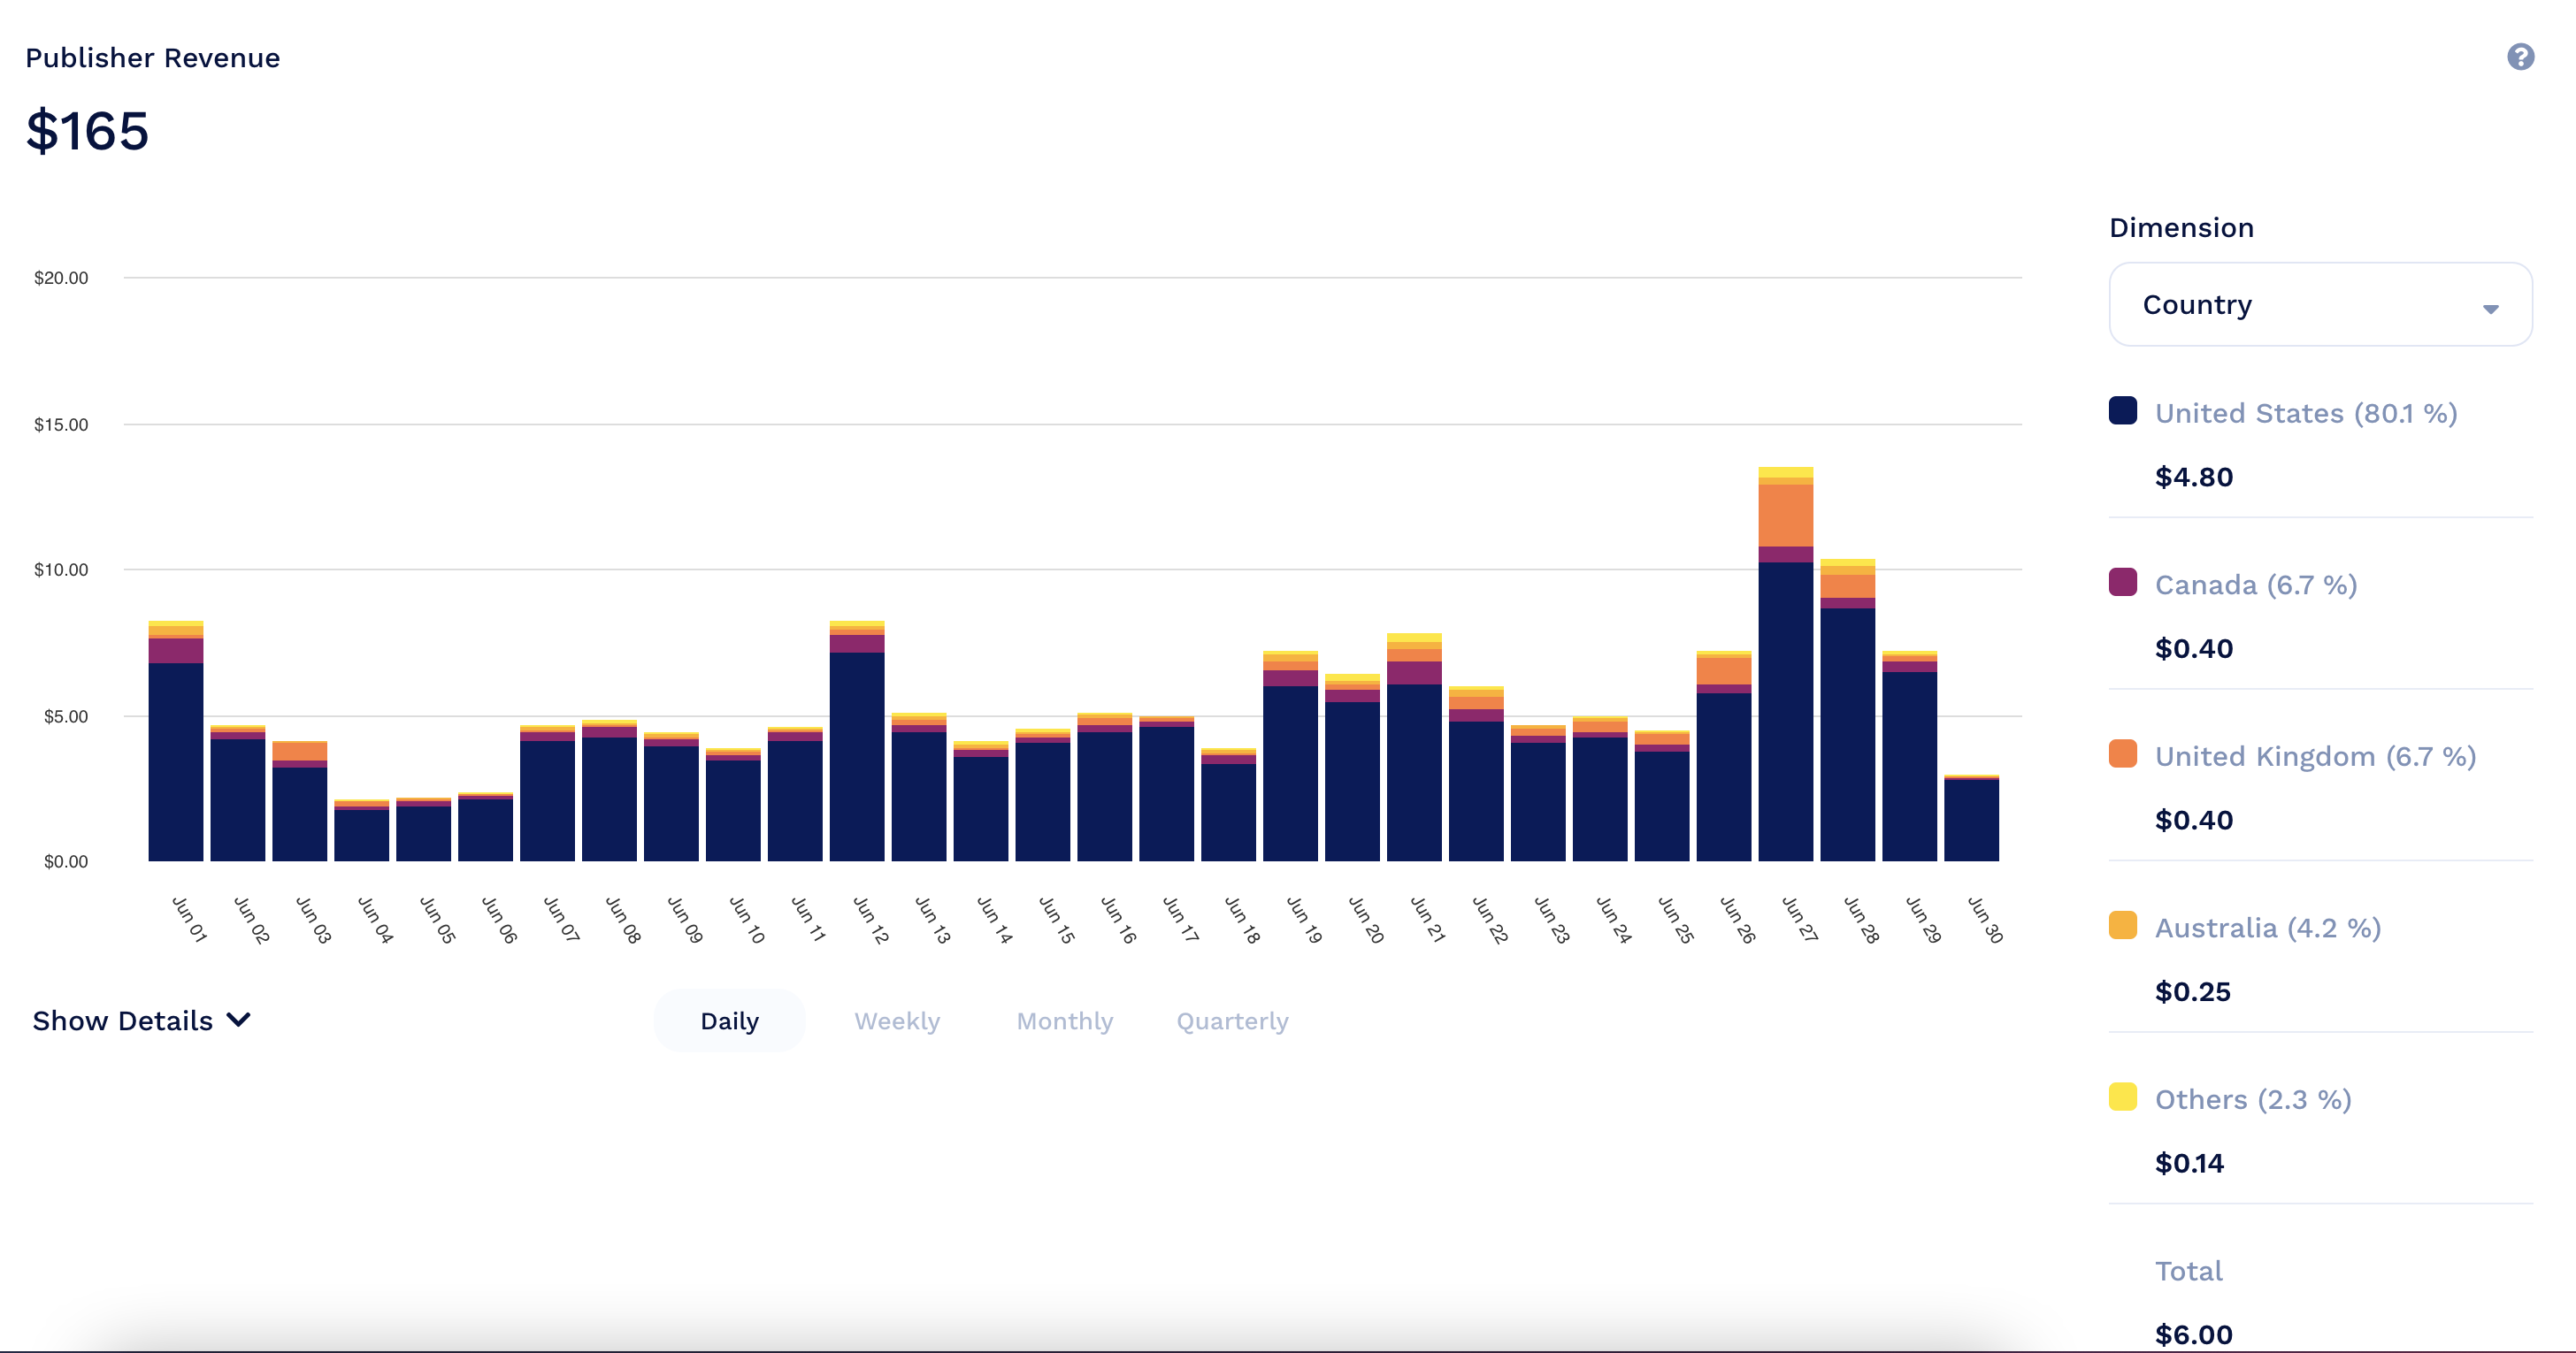
Example of revenue broken down by Country dimension
Secondary Dimensions
Secondary dimensions are also supported allowing the user to select one variable within the primary dimension and then drilling down into that variable to see other dimensions that are impacting that variable. For example, if a spike in revenue is seen within a particular country, the user can drill down into a particlular country and then select "Device" as the secondary dimension to see if Web or Mobile drove the spike. To drill down:
- Hover over one of the variables within the table which will highlight that variable
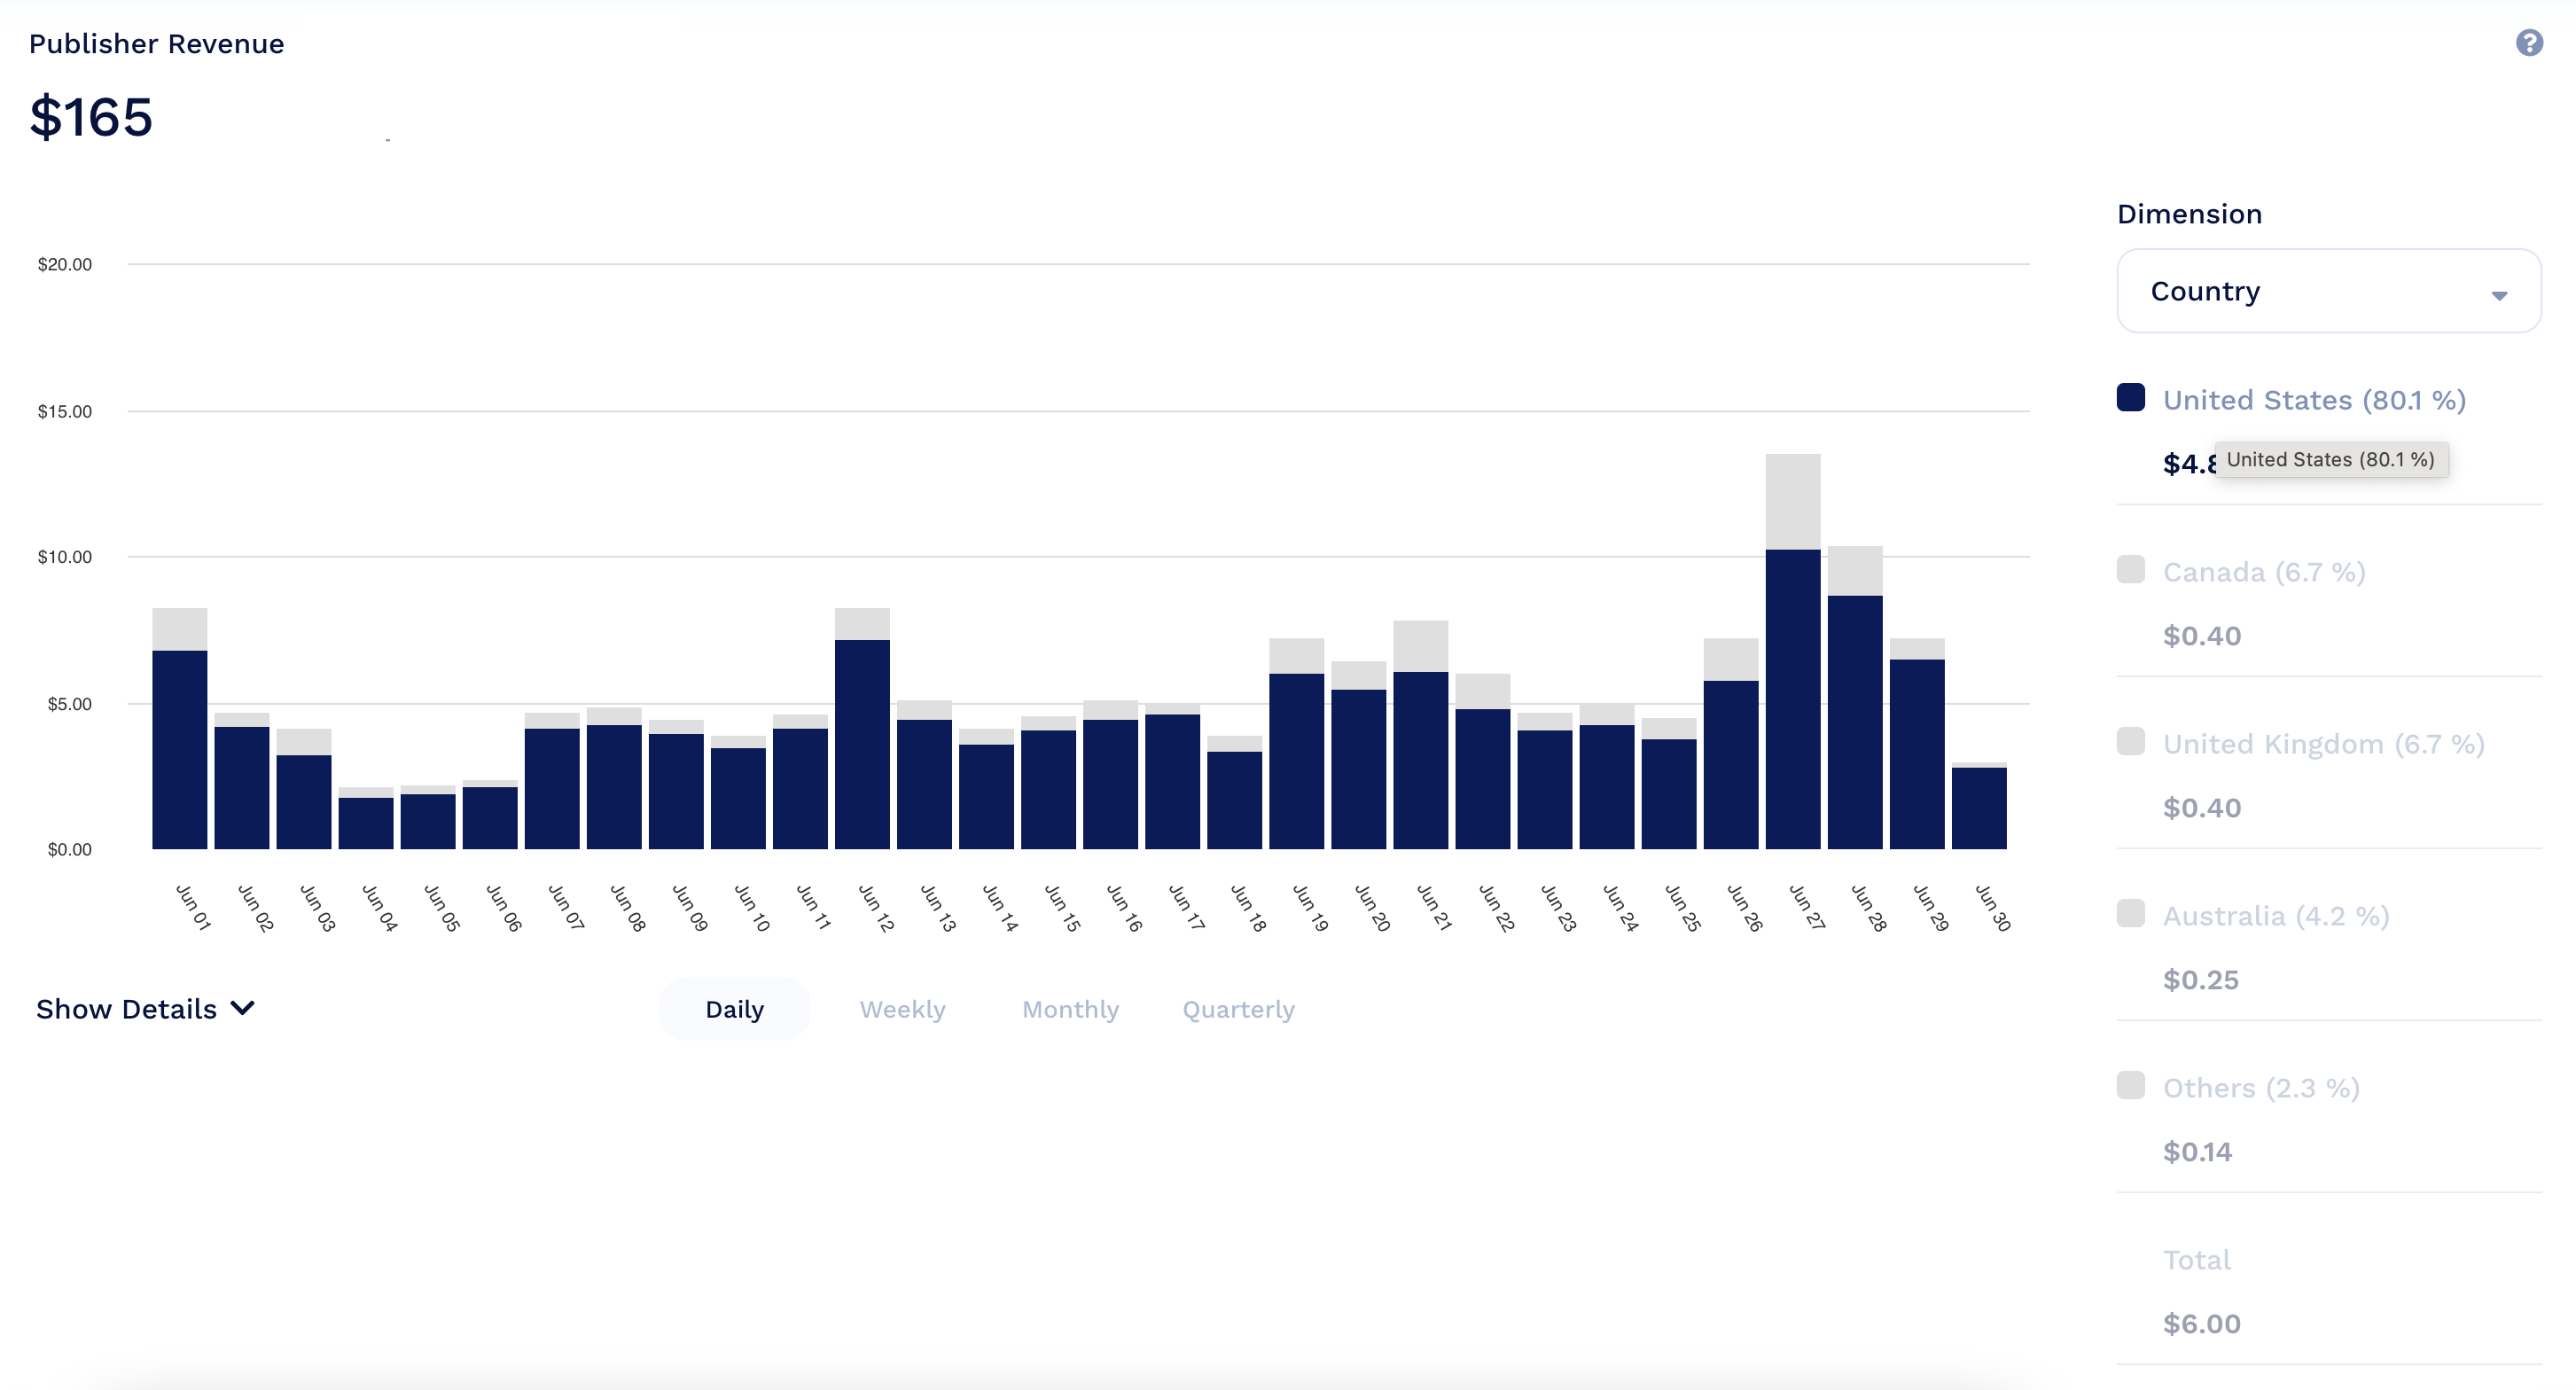
Hovering over a variable wiihtin the table: United States in this example
- Click the variable and then it will become the primary dimension and then the drop-down list of secondary dimensions will be available
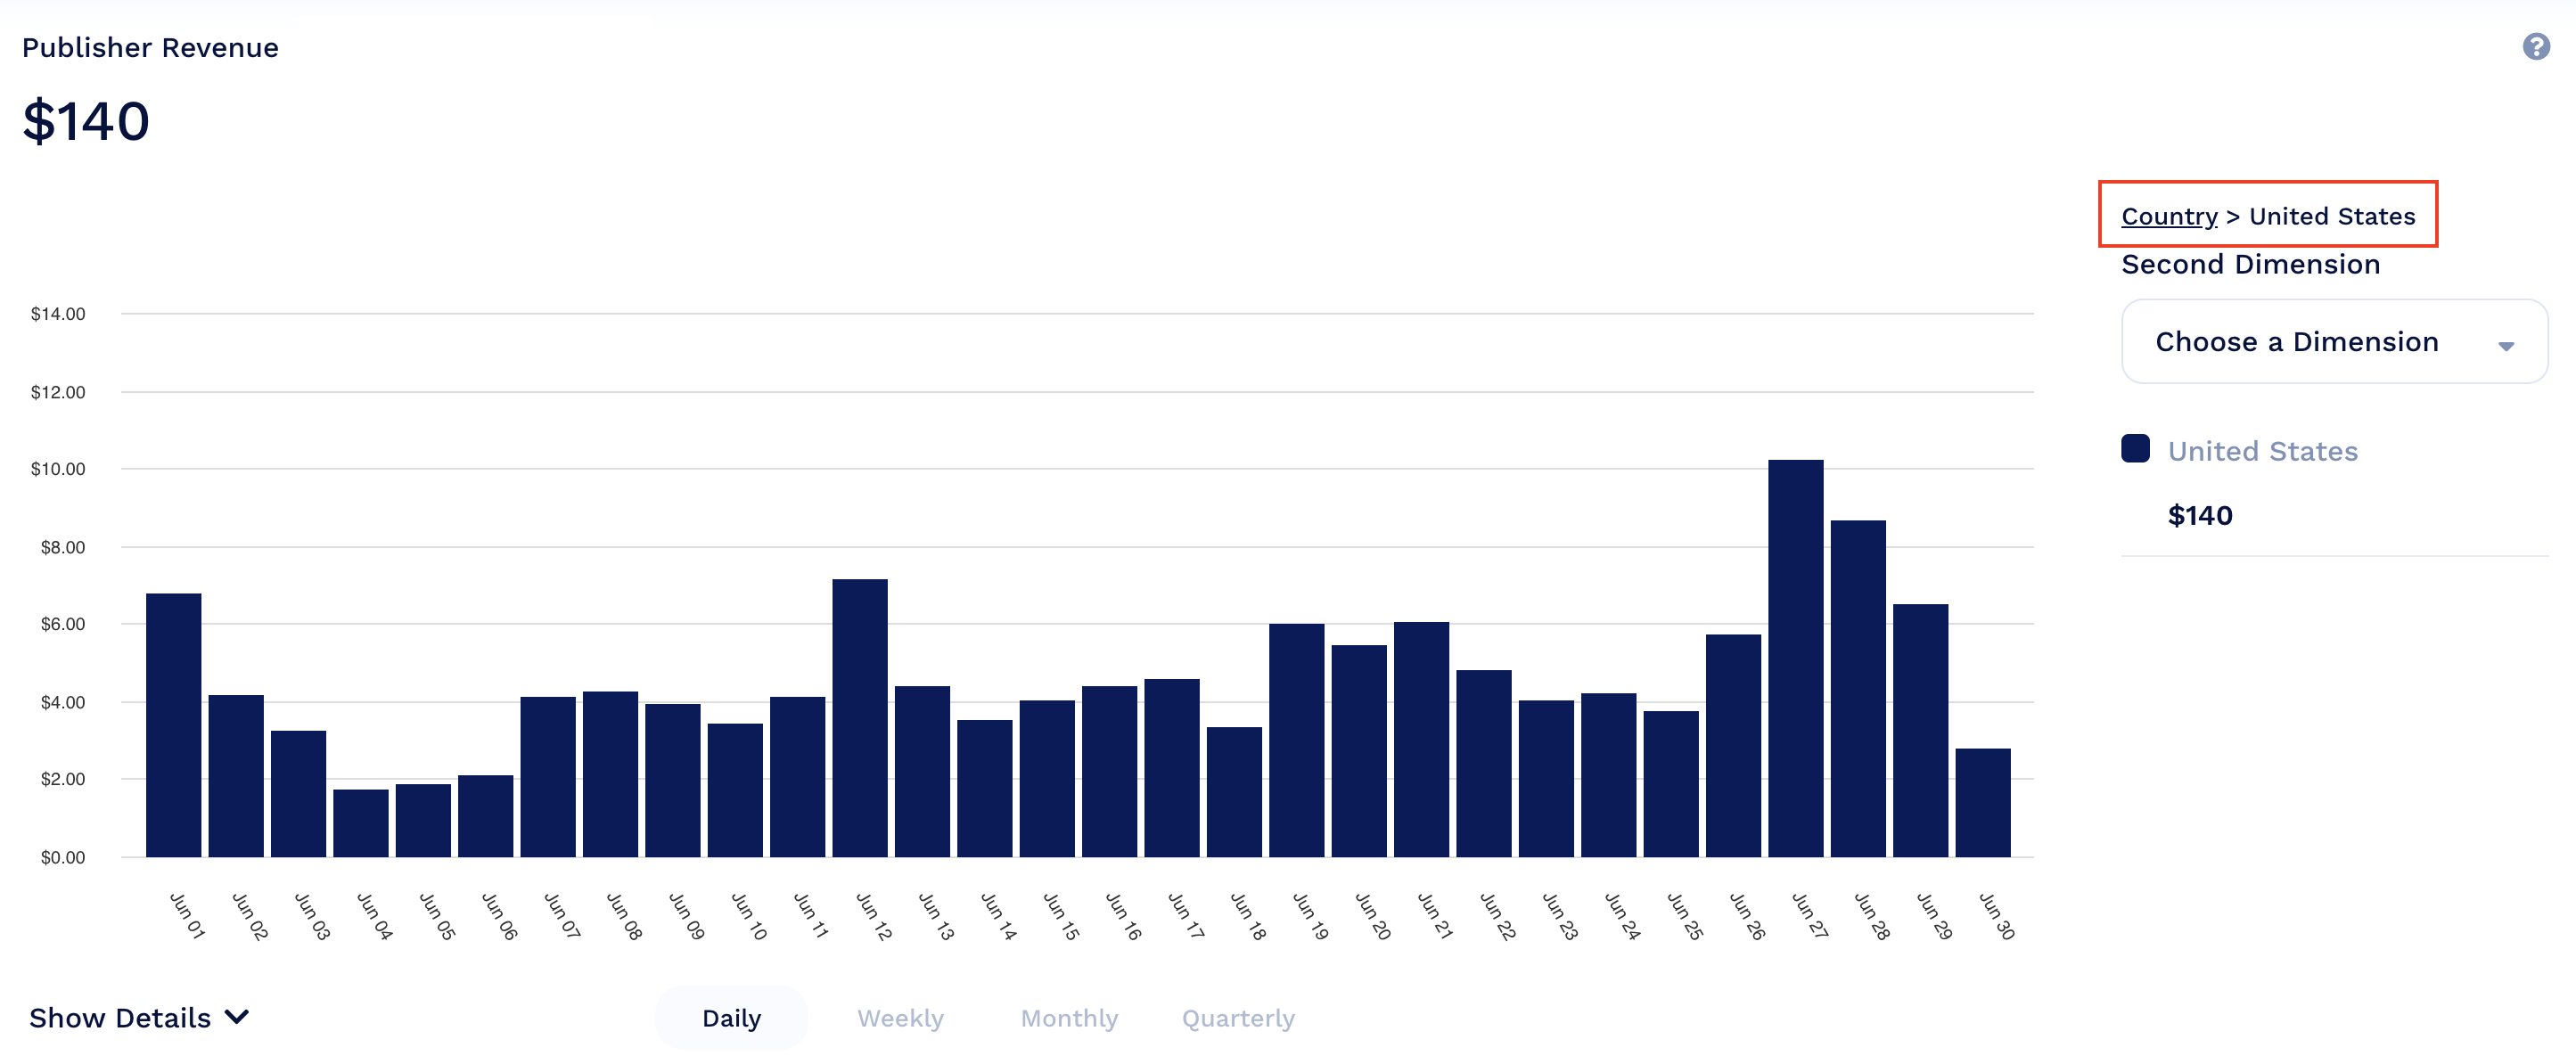
Revenue broken down by county (United States) and ready to select Secondary Dimension
- Once the variable is selected in primary dimension (like United States above), then the Secondary Dimension drop-down is displayed allowing user to select a secondary dimension on which to break down the data of the selected primary dimension.
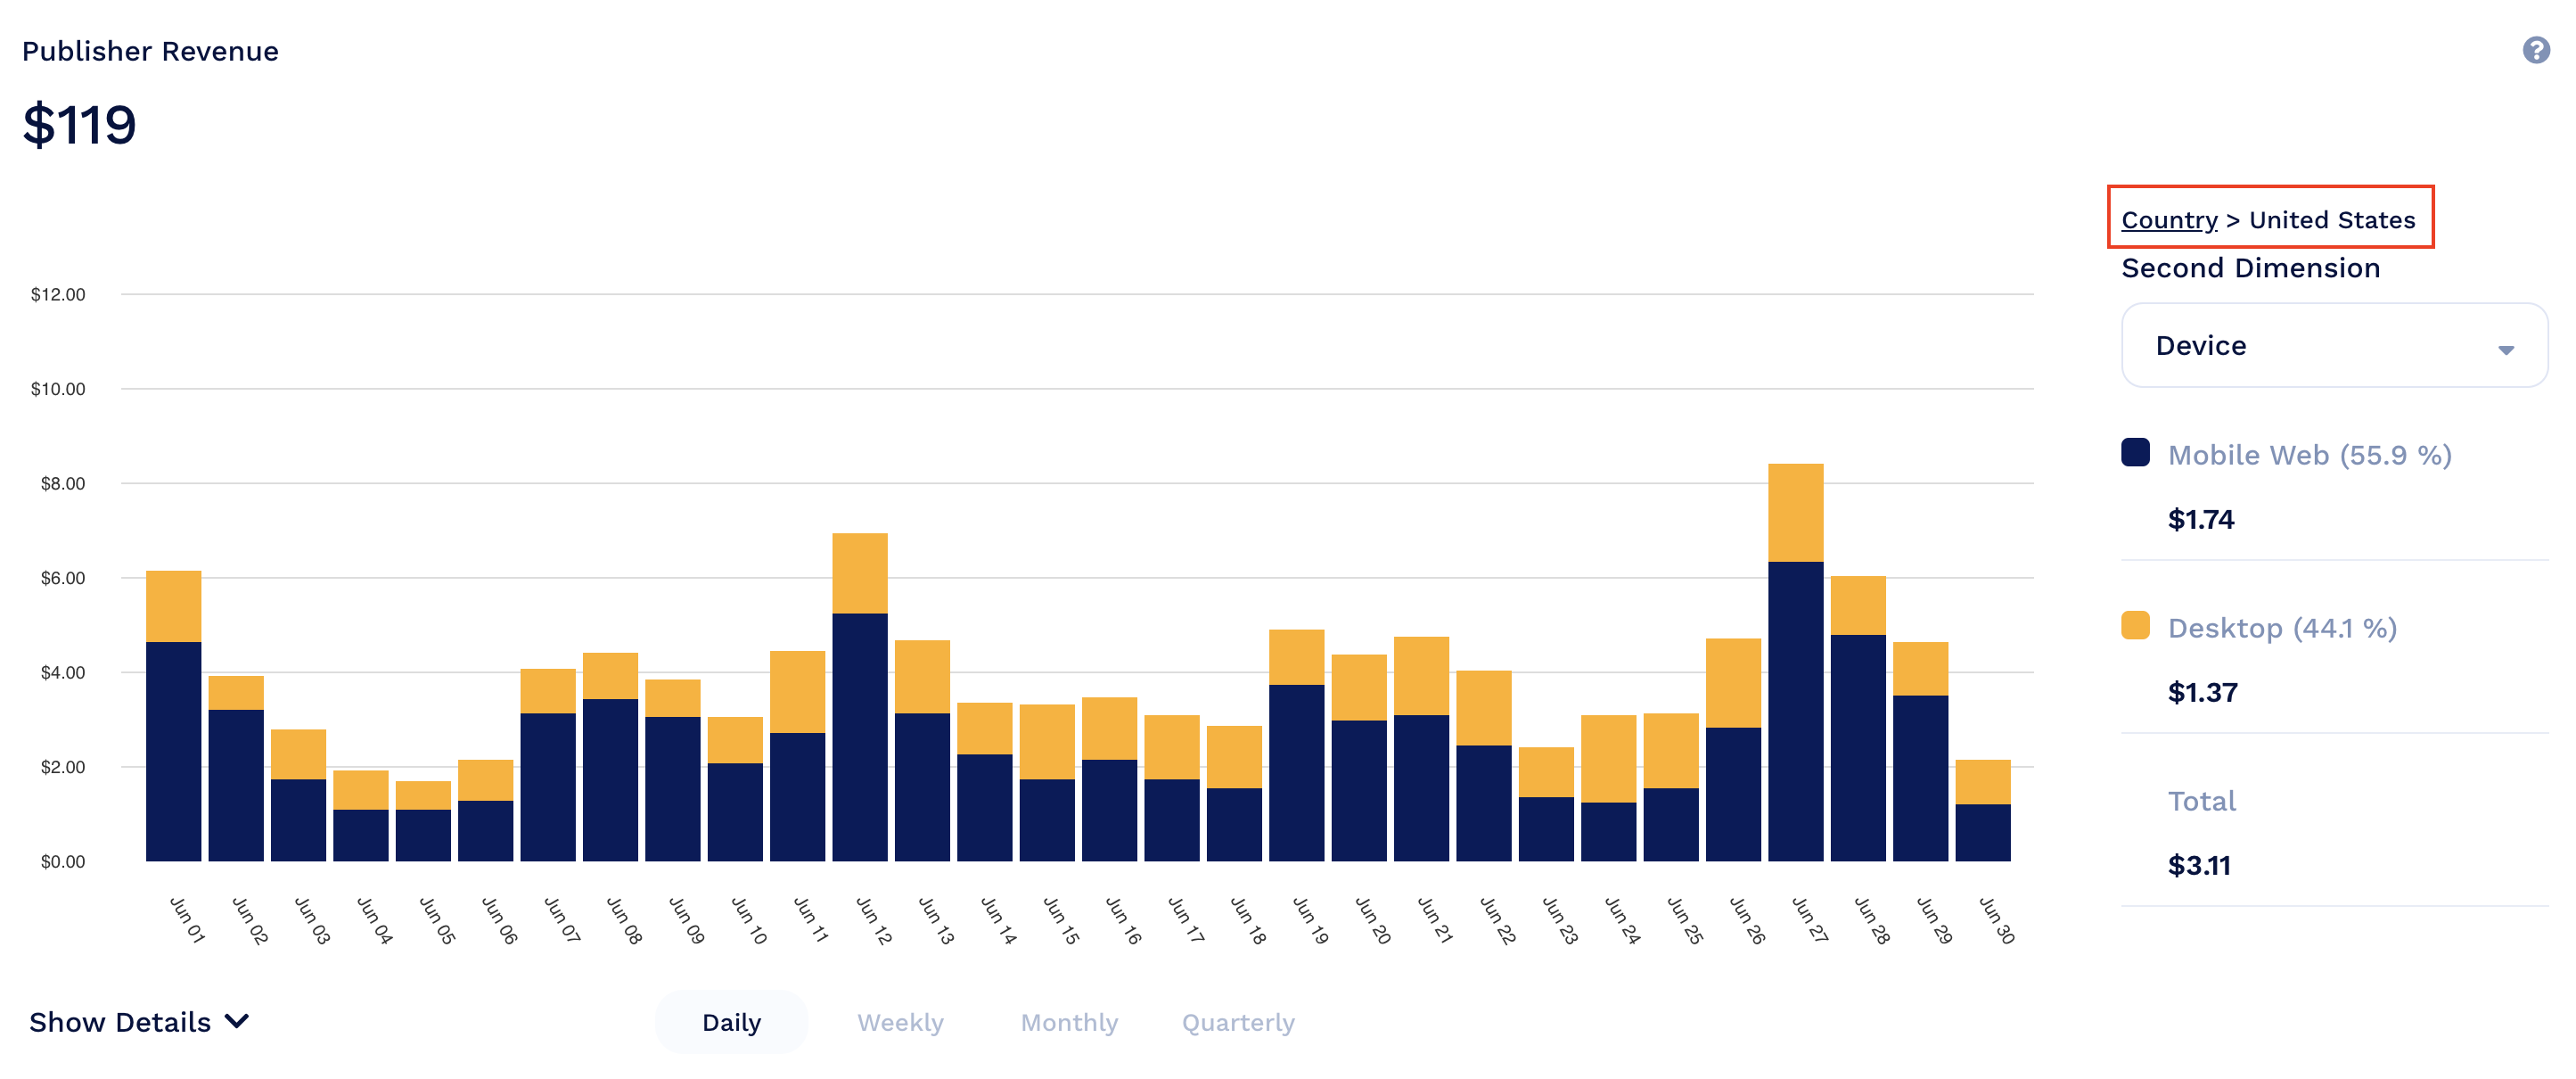
Revenue broken down by United States and then by Device (secondary dimension)
Publisher Revenue Report
Revenue is your portion of revenue after fees and the negotiated Insticator portion of the revenue share.
Factors that can influence revenue are:
- Seasonality
- CPM
- Page views
- Session duration
- Ad sizes
- Quantity of ad placements
- Ad formats (display, video)
- Ad fill rates
- Viewability
Available dimensions for Publisher revenue include:
- Site
- Country
- Device
- Ad Unit
- Product
- Revenue Type (Display, Video, etc)
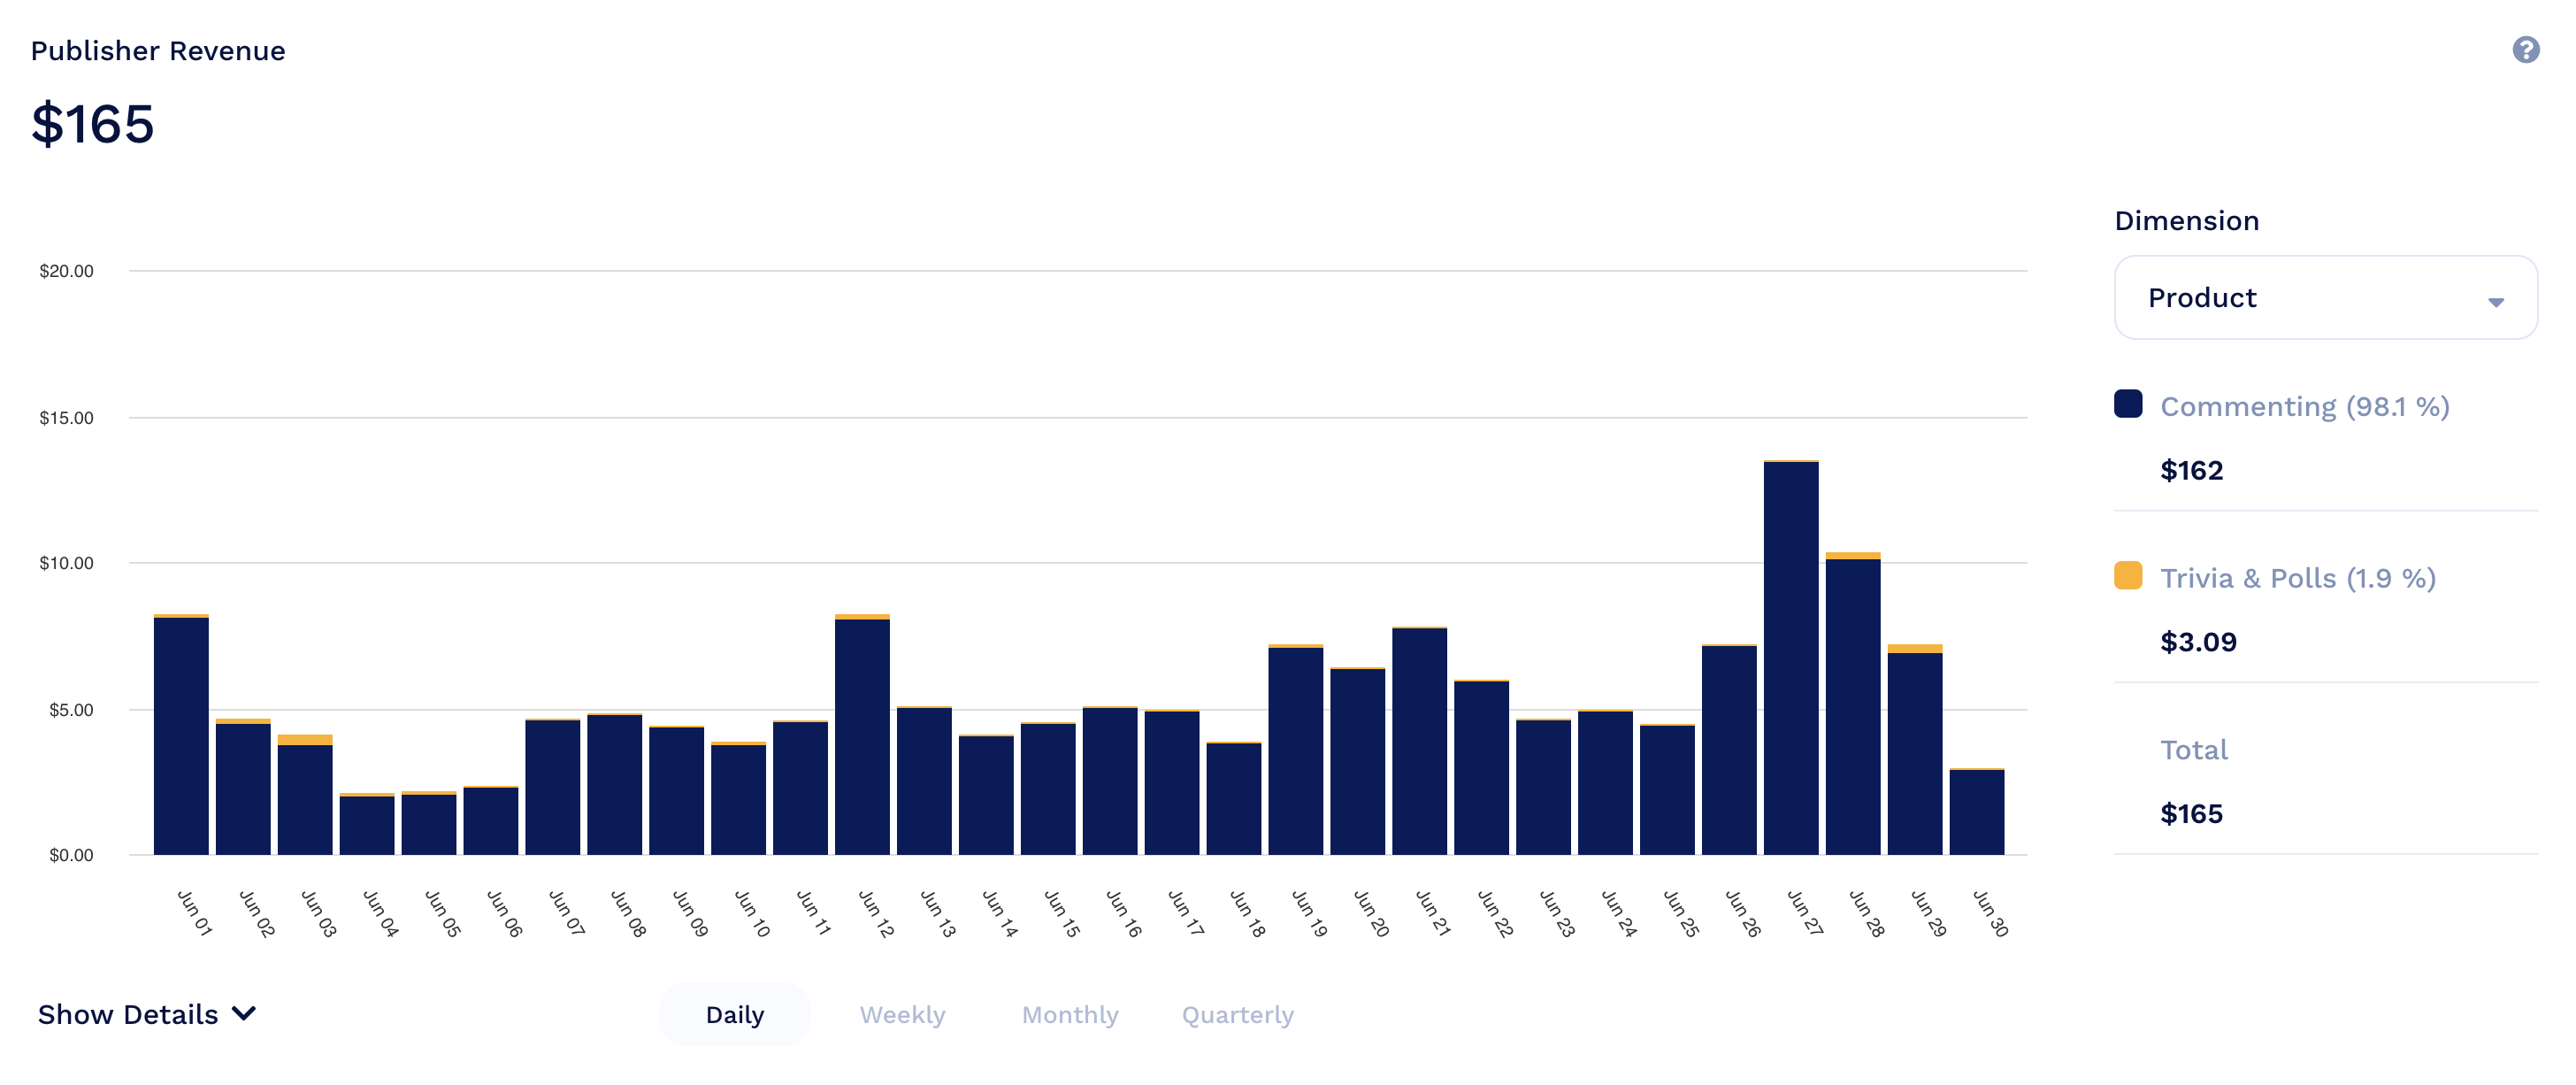
- The Publisher Revenue metric will reflect the calendar filter date range based on the selected dimensions. It WILL NOT update as the user hovers over the time periods
Average RPM Report
Average RPM is the total net ad revenue per thousand monetizable page views and is calculated by taking the total net revenue, for the selected time period, and dividing it by the total monetizable page views, then multiplying by 1,000.
Note: A “Monetizable Page View” is defined as the first insticator element loaded on a page EXCLUDING the header
Available dimensions for Average RPM include:
- Site
- Country
- Device
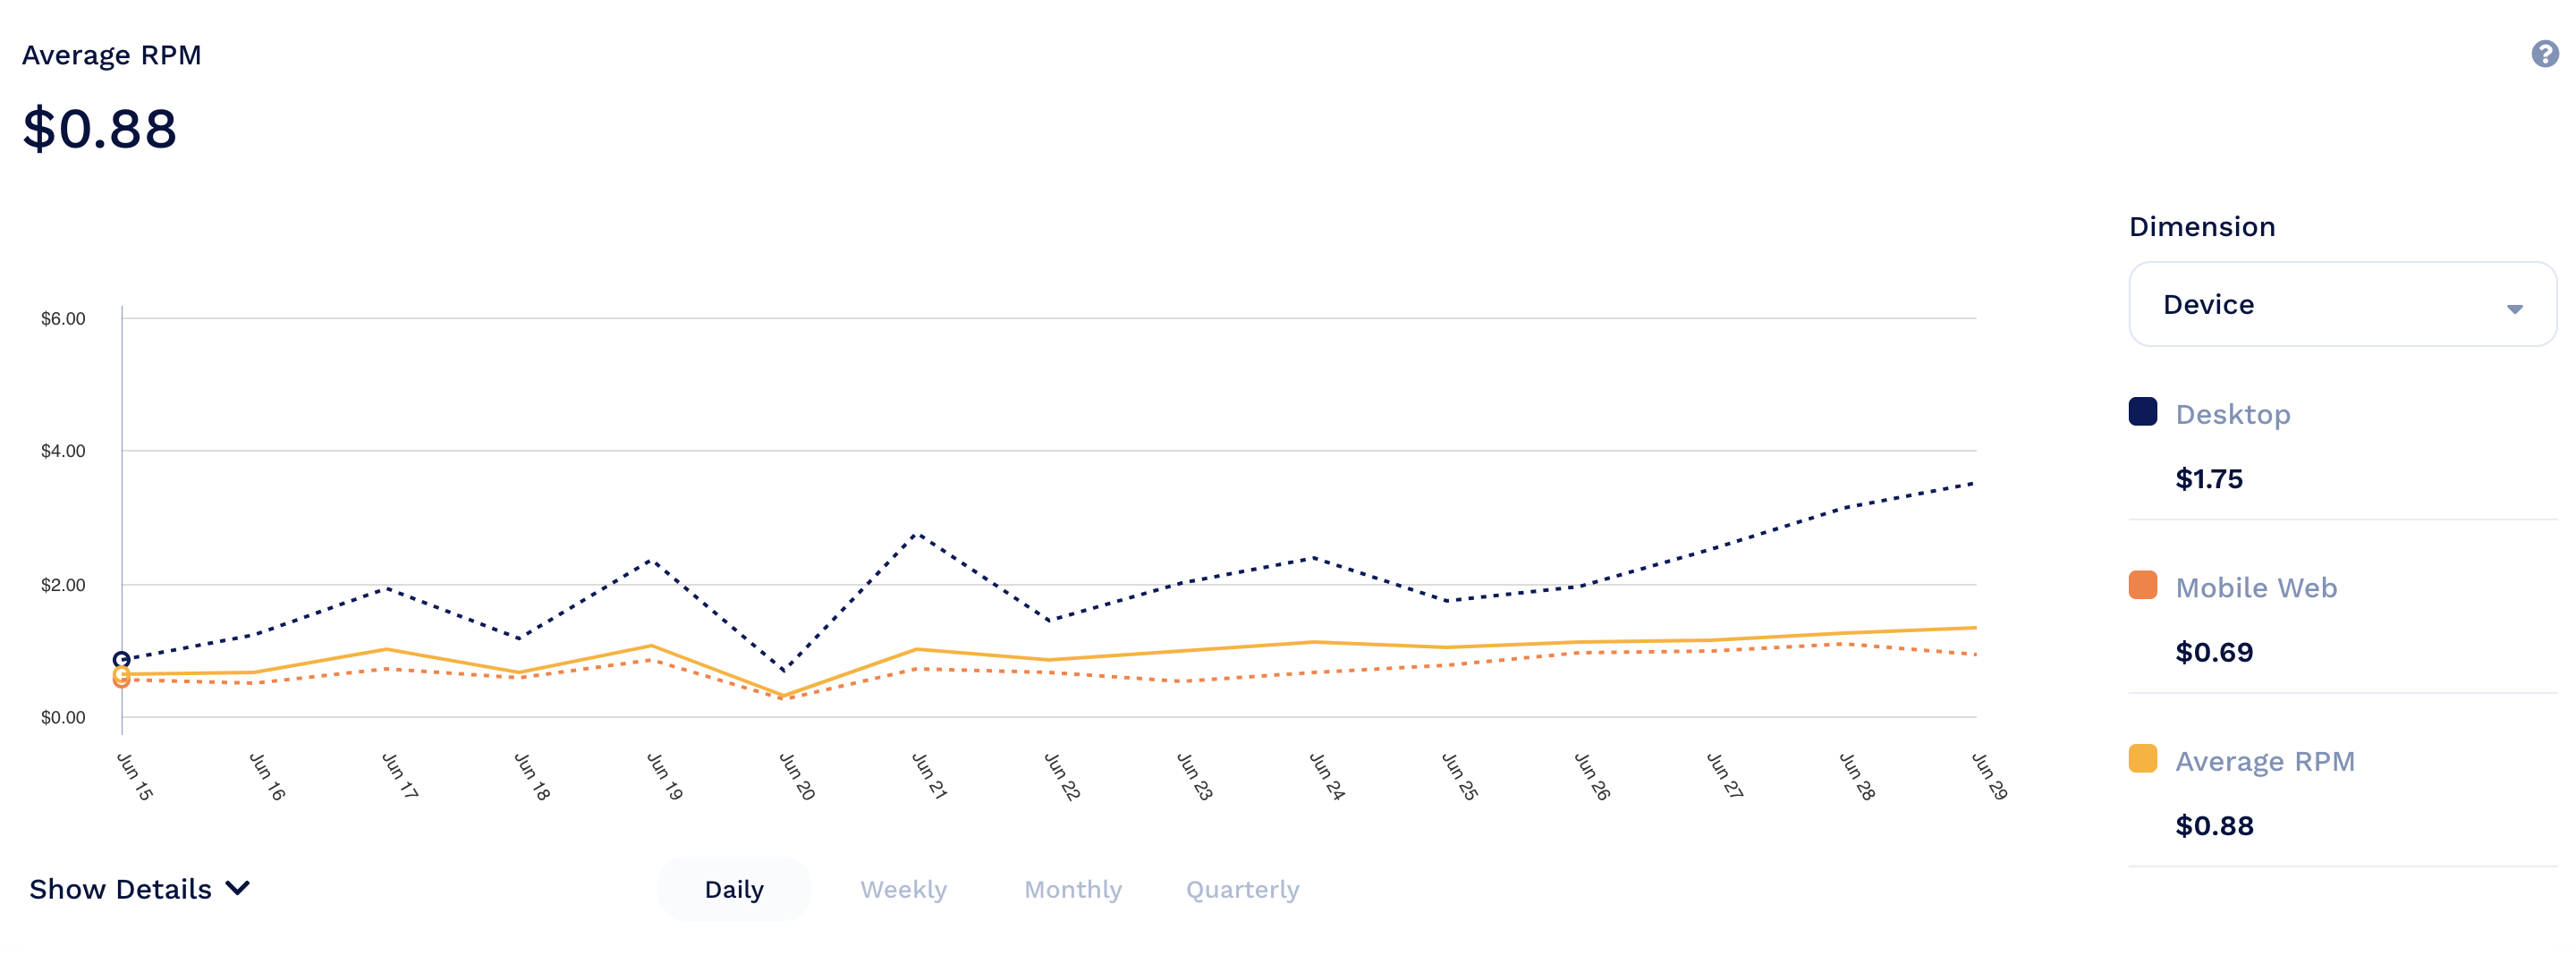
Note: Some publishers may have access to CPM data where they can toggle between RPM and CPM
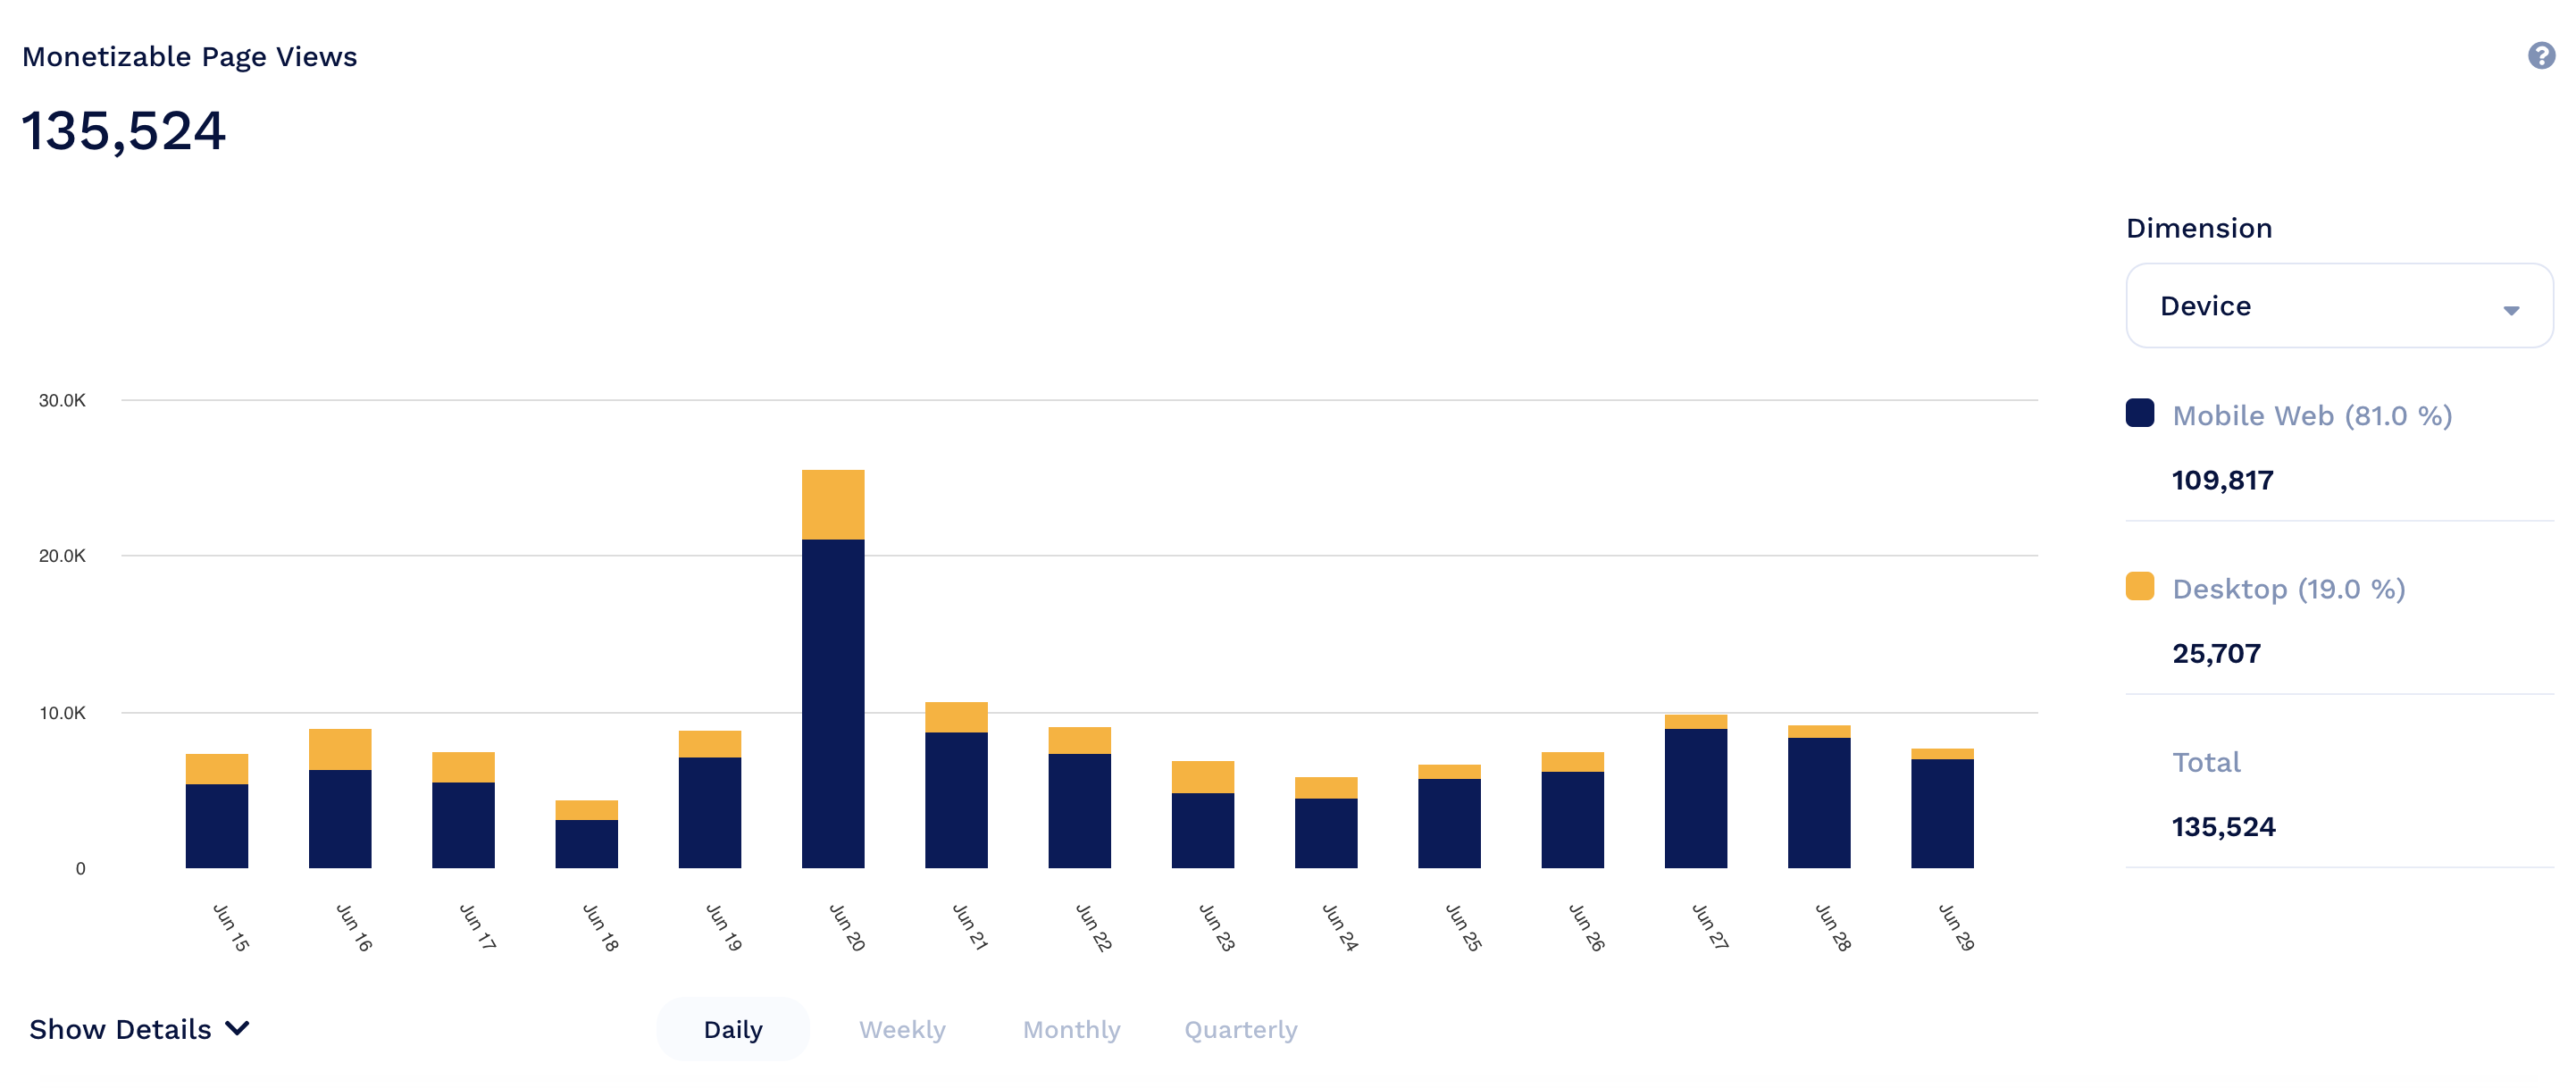
Monetizable Page Views
A Monetizable Page View is defined as the first insticator element loaded on a page EXCLUDING the header. The Monetizable Page Views report is a count of those page views for the selected time period. It excludes page views from bots, robots, crawlers or pages without advertisements.
Available dimensions for Monetizable Page Views include:
- Site
- Country
- Device
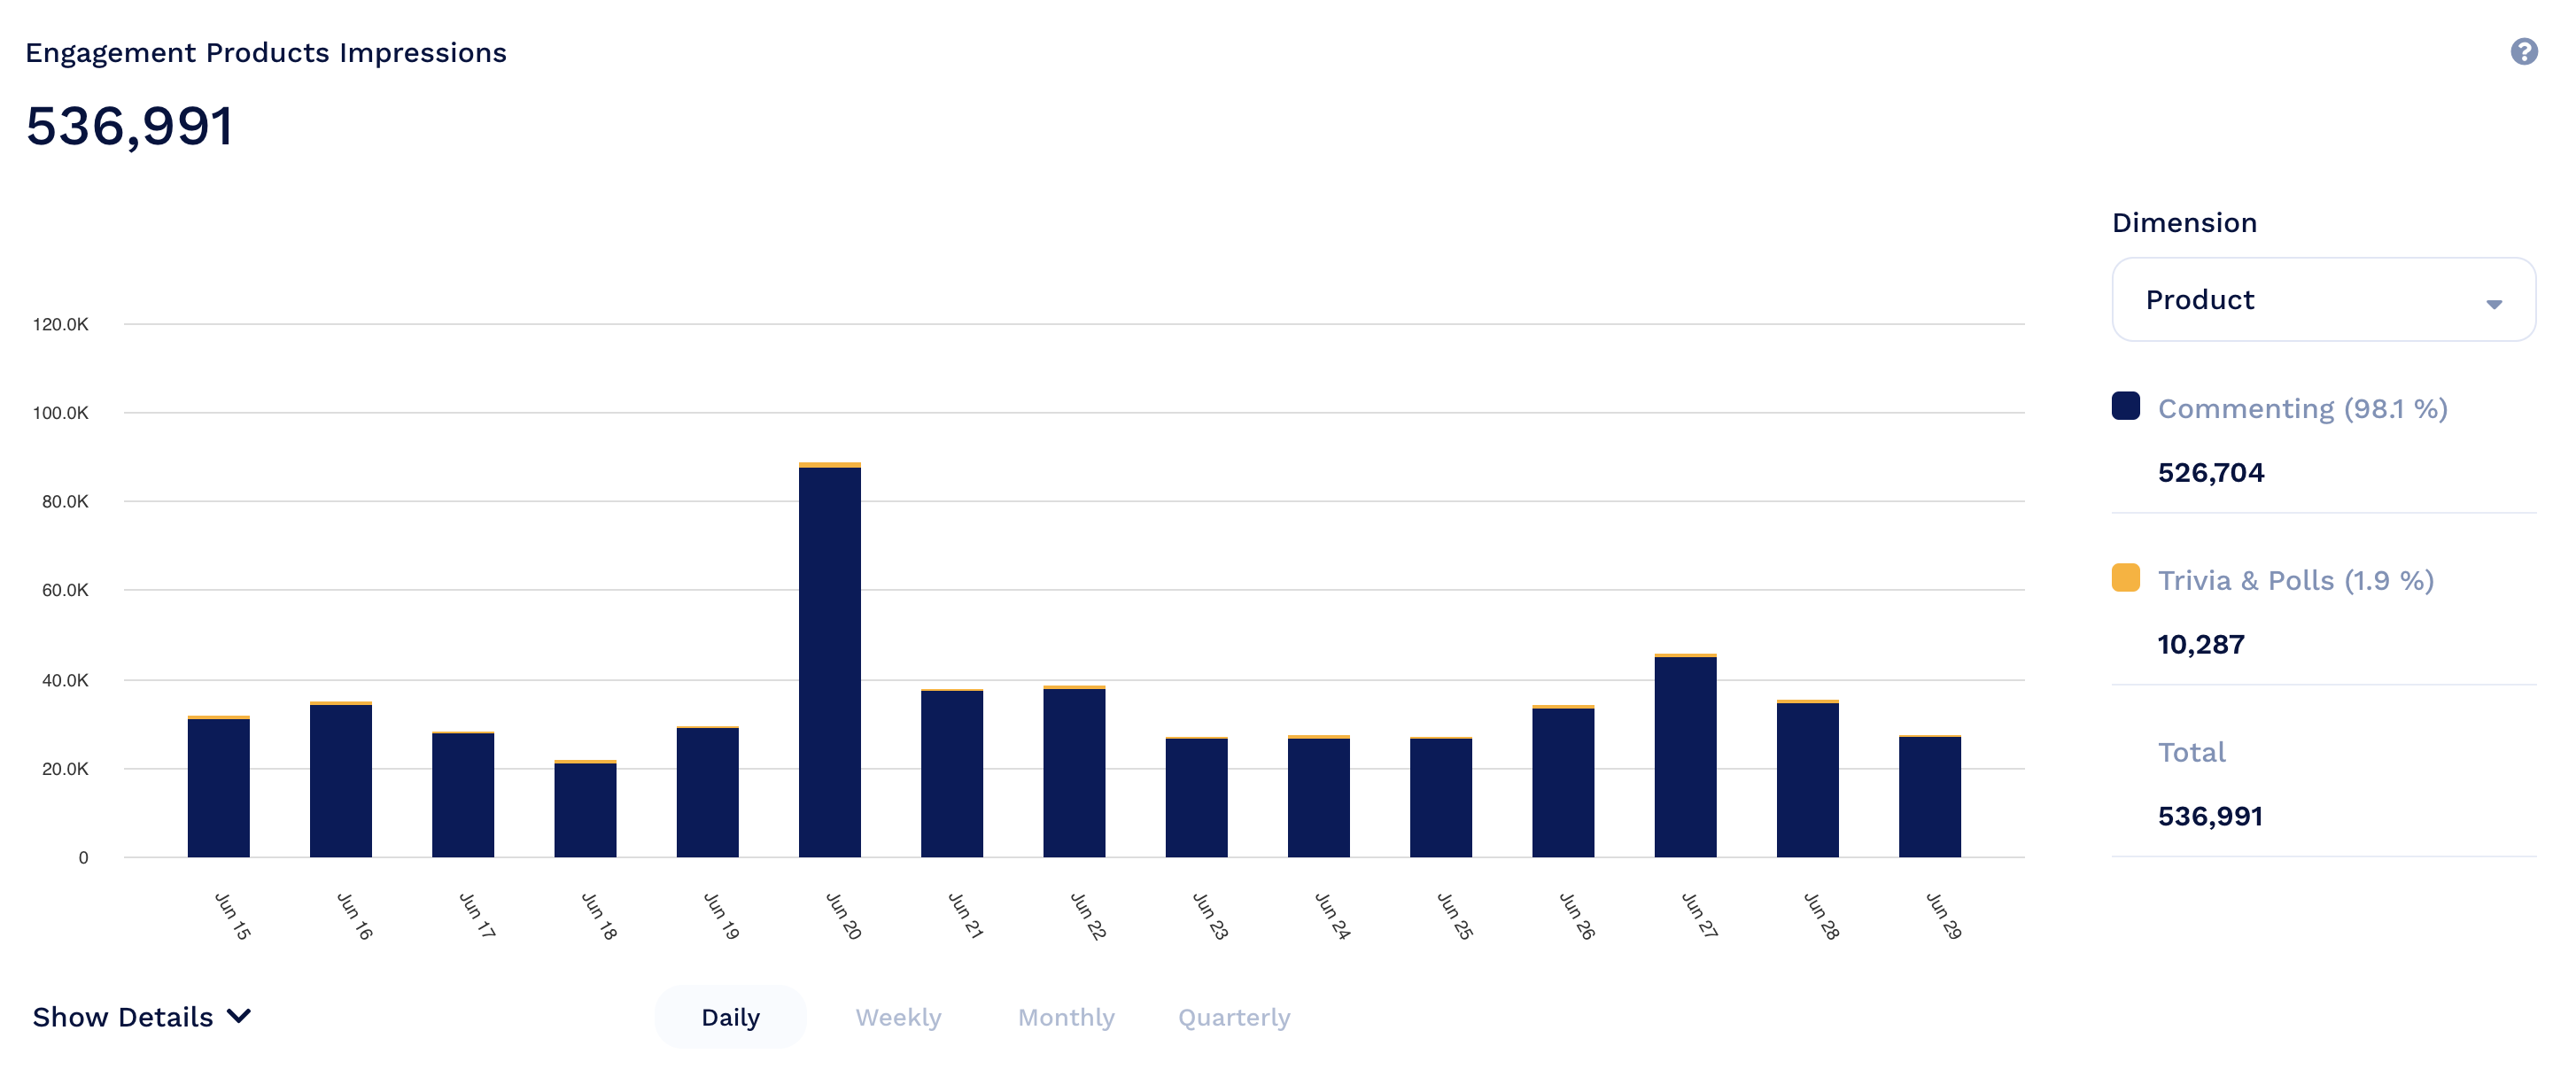
Engagement Products Impressions
Total count of initial load and refresh ad impressions for ONLY your engagement products: Commenting & Trivia & Polls.
Updated 9 months ago