Overview Dashboard
The Overview page is the main dashboard where you can view the revenue details for all the websites, devices used, for all the countries, and for the specified date range in a graphical format.
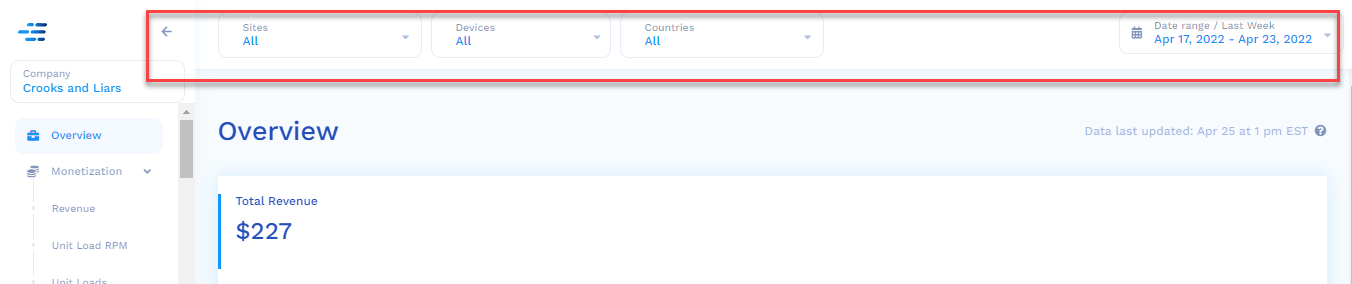
The graphic data representation of the Overview dashboard can be managed with the help of global filters as highlighted in the image below.
The global filters across all the Analytics features are as follows:
- Filter reports across all websites.
- Filter reports across all devices (mobile, web, or both)
- Filter reports across all countries.
- Filter reports for a given time period by selecting dates.
To access the Analytics for the Overview dashboard, navigate to the Overview option in the left panel. The reports that are generated for the Commenting unit are:
- Total Revenue
- Revenue Drivers
Each of these reports for the Overview dashboard is mentioned in detail.
Total Revenue
Total revenue displays a line graph of the total amount of revenue earned. This graph is based on the data that was selected from the options that were selected through the global filters on the Overview dashboard.
- Total revenue for the selected date range is displayed at the top of the graph.
- Hover over the line graph to get the revenue for a particular day.
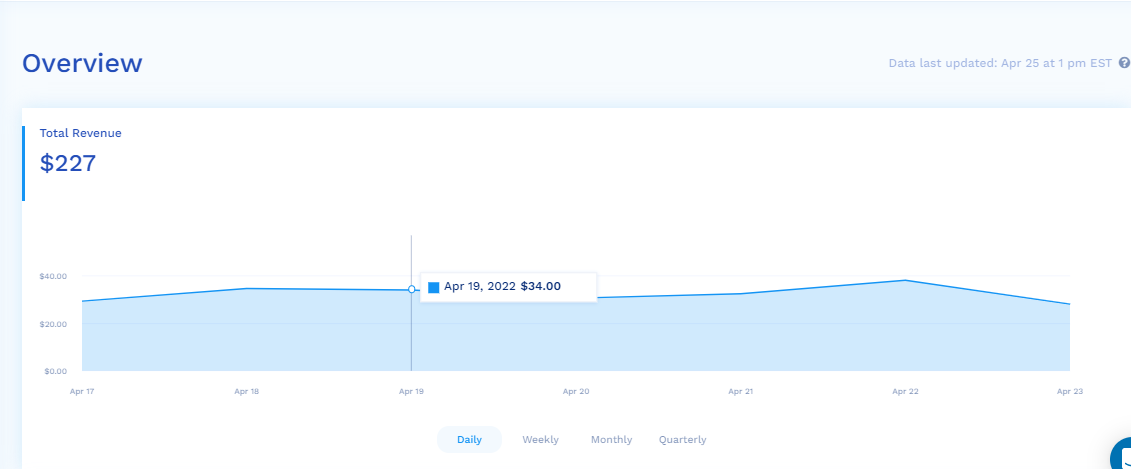
The features of the Total revenue report are:
- The line graph provides the amount of revenue generated on a particular date. If you hover the mouse over the line graph, the revenue amount with the date is displayed.
Revenue Drivers
The Revenue Drivers displays a three-line graph for Revenue, Unit Load RPM, and Unit Loads respectively. Insticator stacks the graphs on top of each other so that within one view you can see how one metric impacts the others.
Revenue
Shown revenue is your total net ad revenue, for the selected time period. Net revenue is your portion of revenue after fees and the negotiated Insticator portion of the revenue share.
Unit Load RPM
Unit Load RPM is the total revenue per thousand unit loads and is calculated by taking the total revenue, for the selected time period, and dividing it by the total number of unit loads, then multiplying by 1,000.
Unit Loads
Unit loads are the ad containers, both video, and display, Insticator loads across each of your pages for all products including Full Ad Management, Commenting, and Trivia. For Commenting and Trivia, we count all ads associated with that product, regardless if it is a single ad or four ads, as a single until load. For example, if we load one ad on the right rail, 2 ads on top of commenting, and another 2 ads at the bottom of commenting it would count as 2 unit loads.
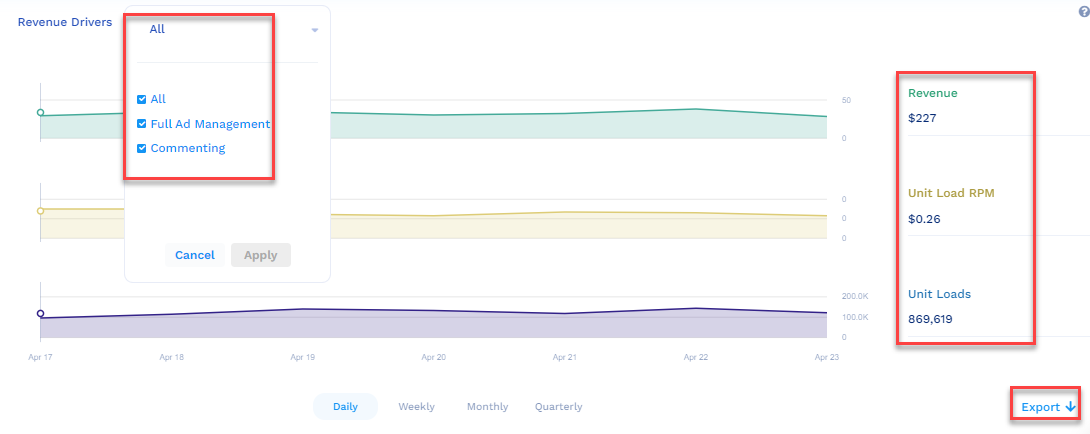
The features of the Revenue Drivers report are:
- The three-line graph is color-coded that provides the Revenue, Unit Load RPM, and Unit Loads for a particular date.
- In the Revenue Drivers report, you have the option to view the revenue of the selected product. The options are:
- All
- Commenting
- Full Ad Management
- On the right side, notice how the unit for Revenue, Unit Load RPM, and Unit Loads change when you hover the mouse over the graphs.
You can export the revenue report from Revenue Drivers from the Export option located at the bottom right corner of the report.
Updated 9 months ago