Analytics
Insticator has designed the Analytics page to accommodate reports on all the products like Commenting, Trends and Reactions, Trivia and Polls, etc. The Analytics page provides a plethora of reports in a graphical format to depict various aspects of the products.
The global filters across all the Analytics features are as follows:
- Sort reports across all websites.
- Sort reports across all devices (mobile, web, or both)
- Sort reports across all countries.
- Sort reports for a given time period by selecting dates.
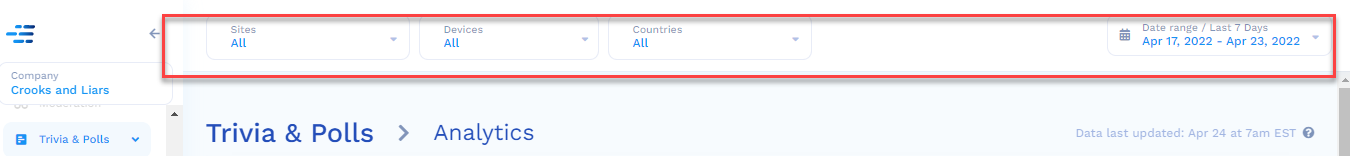
To access the Analytics for the Trivia & Polls unit:
- Navigate to Trivia & Polls> Analytics.
The reports that are generated for the Commenting unit are:
- Total Answers
- Unique Trivia users
- Top Poll & Quiz Cards
- Top Skipped Cards
All the reports are color-coded for ease of understanding. Each of these reports for the Trivia & Polls unit is mentioned in detail.
Total Answers
Break down of answers between Polls and Quizzes. A “Unique User” for Trivia & Polls is defined as a user who answered at least one card during the rolled-up time period (daily, weekly, monthly, etc.). The average Cards per Unique User is calculated by taking the Total Answers and dividing them by the total number of unique users.
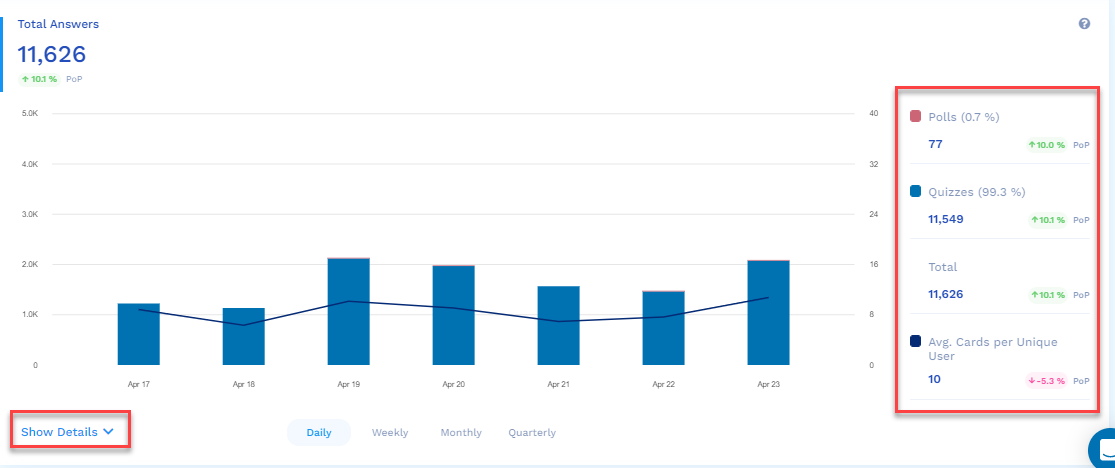
The features of the Total Answers report are:
- The red section of the graph is the number of users who answered a poll over the selected period of time (by default, it is seven days, and the maximum is 30 days).
- The blue section of the graph is the number of users who answered the quiz over the selected period of time (by default, it is seven days, and the maximum is 30 days)
- On the right side, you will see the following color-coded analytics for the selected period of time (by default, it is seven days, and the maximum is 30 days):
Total number of users who answered the polls
 Total number of users who answered the quizzes
Total number of users who answered the polls and quizzes (addition)
 The average cards per unique user in the form of a line graph - The Show Details drop-down provides the Total Answers analytics for each day in tabular format.
- If you hover the mouse over each bar of the graph, the analytics for each bar/day is displayed on the right side of the graph.
Unique Trivia Users
A Unique User for Trivia & Polls is defined as a user who answered at least one card during the rolled-up time period (daily, weekly, monthly, etc.).
The Engagement Rate is calculated by taking the total number of trivia answers and dividing it by the UNIQUE viewable trivia units on the page.
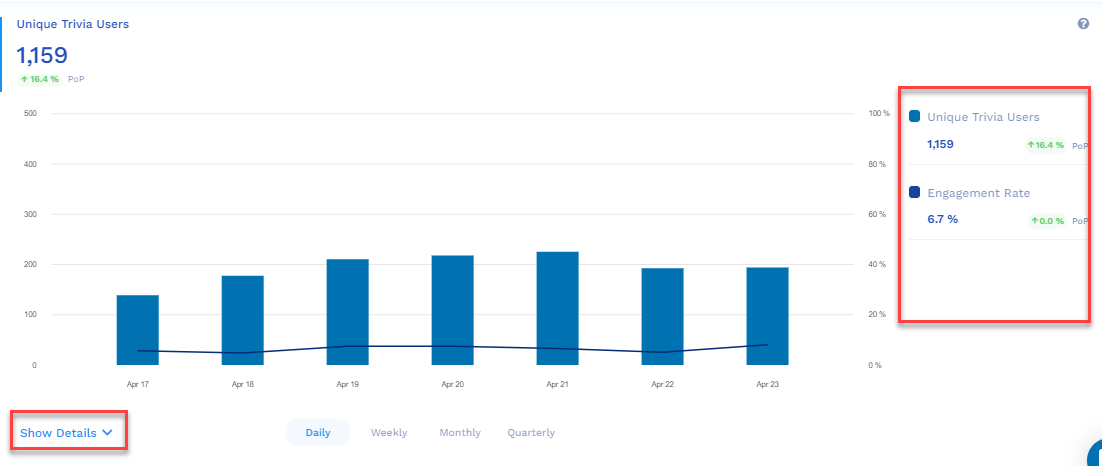
The features of the Unique Trivia Users report are:
- The blue section of the graph is the number of unique trivia users who answered over the selected period of time (by default, it is seven days, and the maximum is 30 days)
- On the right side, you will see the following color-coded analytics for the selected period of time (by default, it is seven days, and the maximum is 30 days):
Total number of unique trivia users who answered
 The engagement rate in the form of a line graph - The Show Details drop-down provides the Unique Trivia Users analytics for each day in tabular format.
- If you hover the mouse over each bar of the graph, the analytics for each bar/day is displayed on the right side of the graph.
Top Poll & Quiz Cards
The table shows the top 50 most popular cards based on the number of responses. The table also includes the answers to the questions with a breakdown by the percentage of the total and the response rate for each answer.
Updated 9 months ago