Custom Data Exports
Report Builder allows a user to create a custom report of the desired metrics. That report can immediately be downloaded via Excel or CSV or can be scheduled to be delivered at the a defined frequency via a recurring email.
Report Builder is accessed via the Publisher Portal and is on the left main navigation.
Report Builder accessed in main Publisher Portal menu (red box)
Global Filters
As Report Builder is selected from the menu, the Global Filters that are already applied as the page is opened will be set by default. Those filters include Sites, Devices, Countries, and Calendar. By persisting these filters, it is easy to either immediately download and/or setup a recurring email of the data without needing to reconfigure the filters. The Global Filters will be disabled on the page but any of the filters can be changed within Report Builder as defined below.
List of Custom Reports
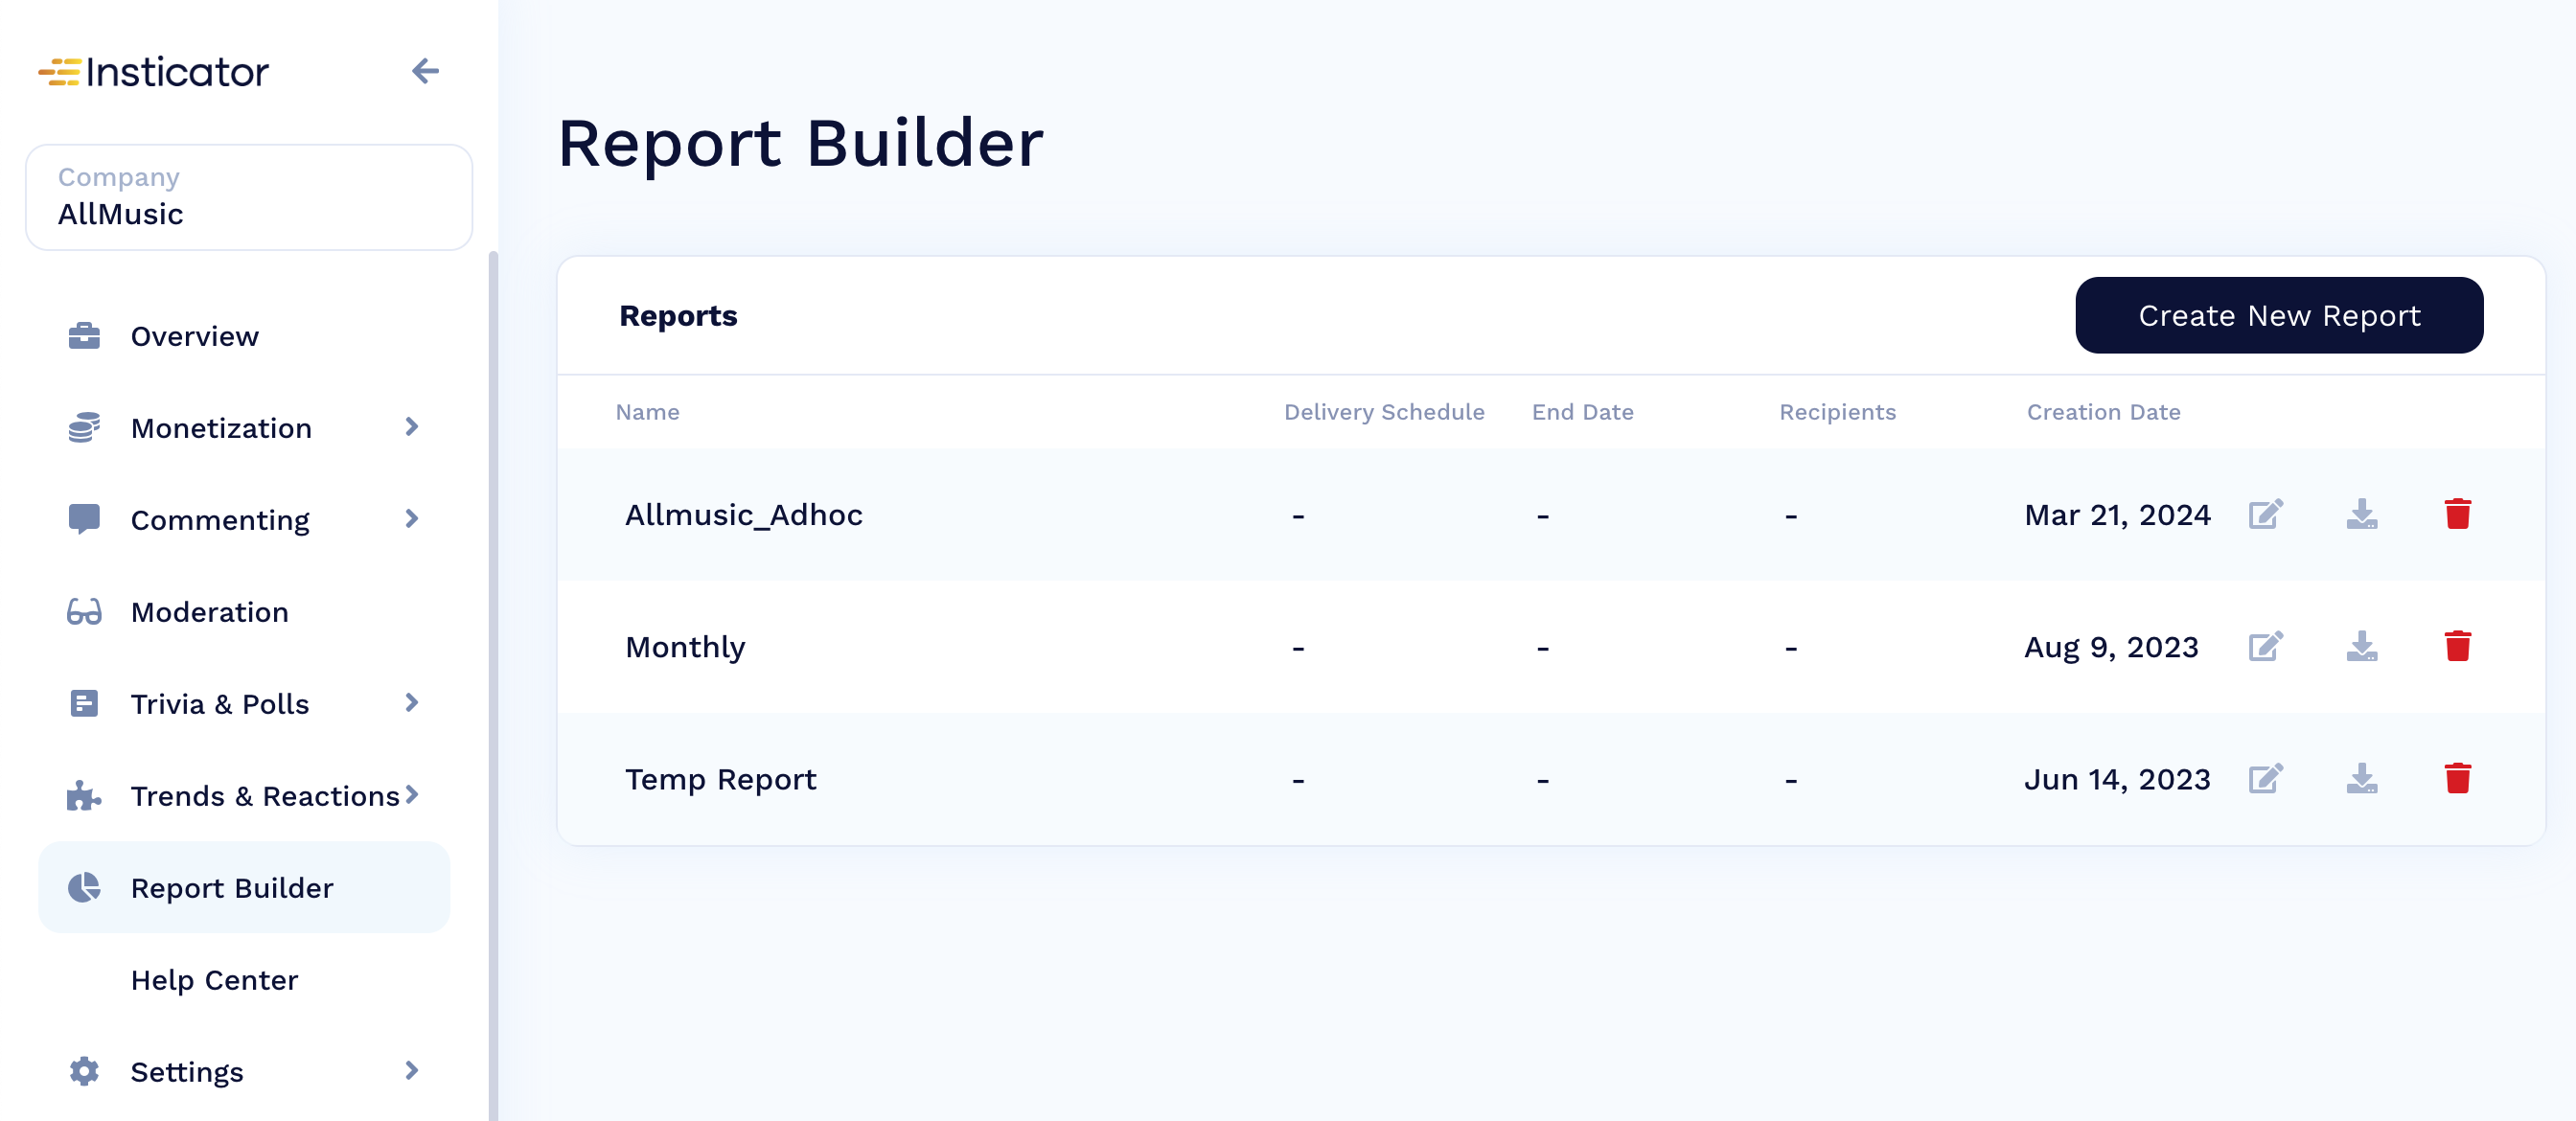
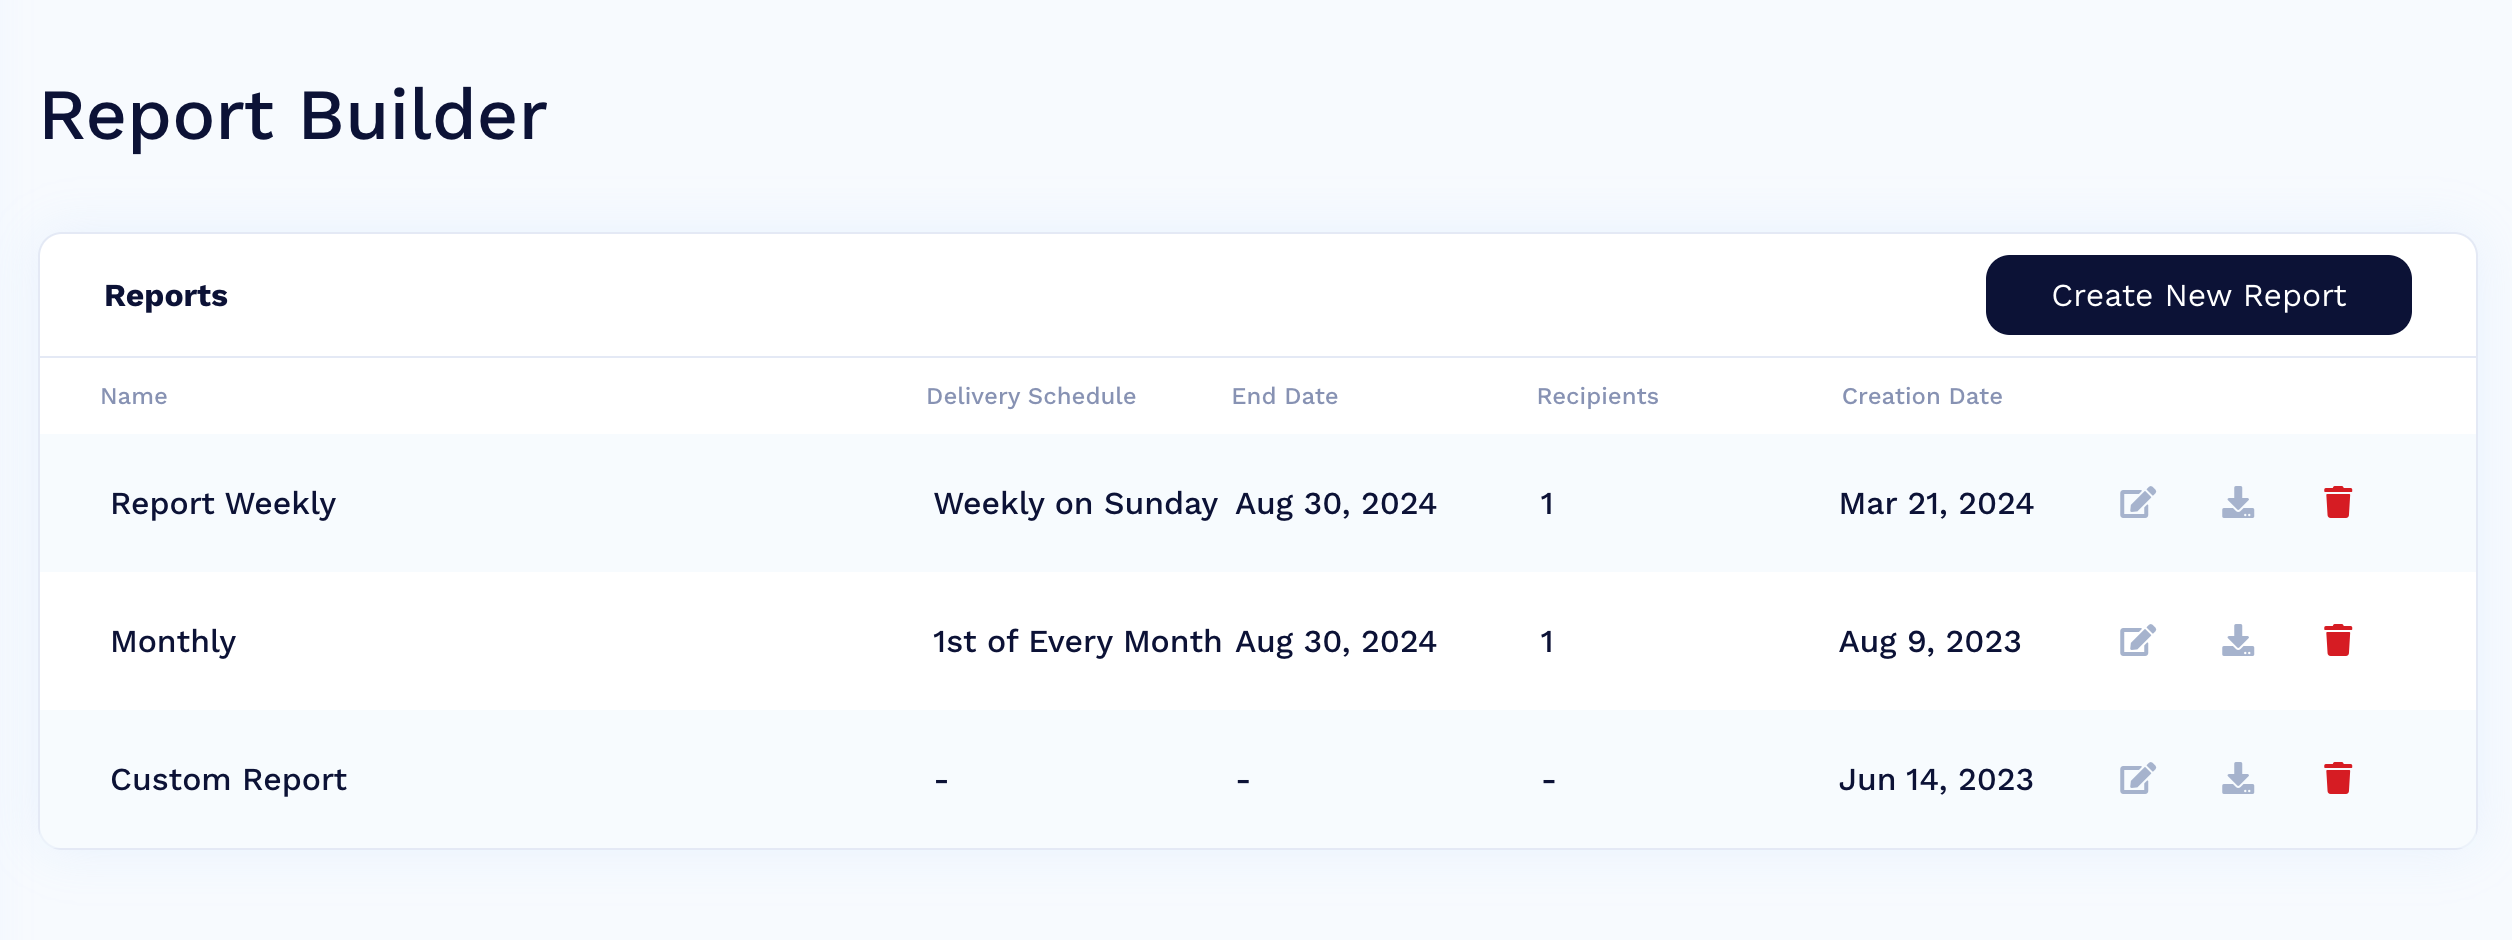
As Report Builder menu link is clicked, user will see a list of all previous saved custom reports created by users associated with their account. The list includes:
- Name - cusomized name of the report
- Delivery Schedule - reports can be scheduled for a Daily, Weekly, or Monthly recurring timeframe
- End Date - specifies if there is an end date for the reports meaning they won't be delivered after that date. N/A means there is no End Date
- Recipients - number of recipents who are scheduled to receive the report
- Action icons - there are 3 actions that can be taken for each report: Edit, Delete, Download (will download the report immediately)
List of Custom Reports
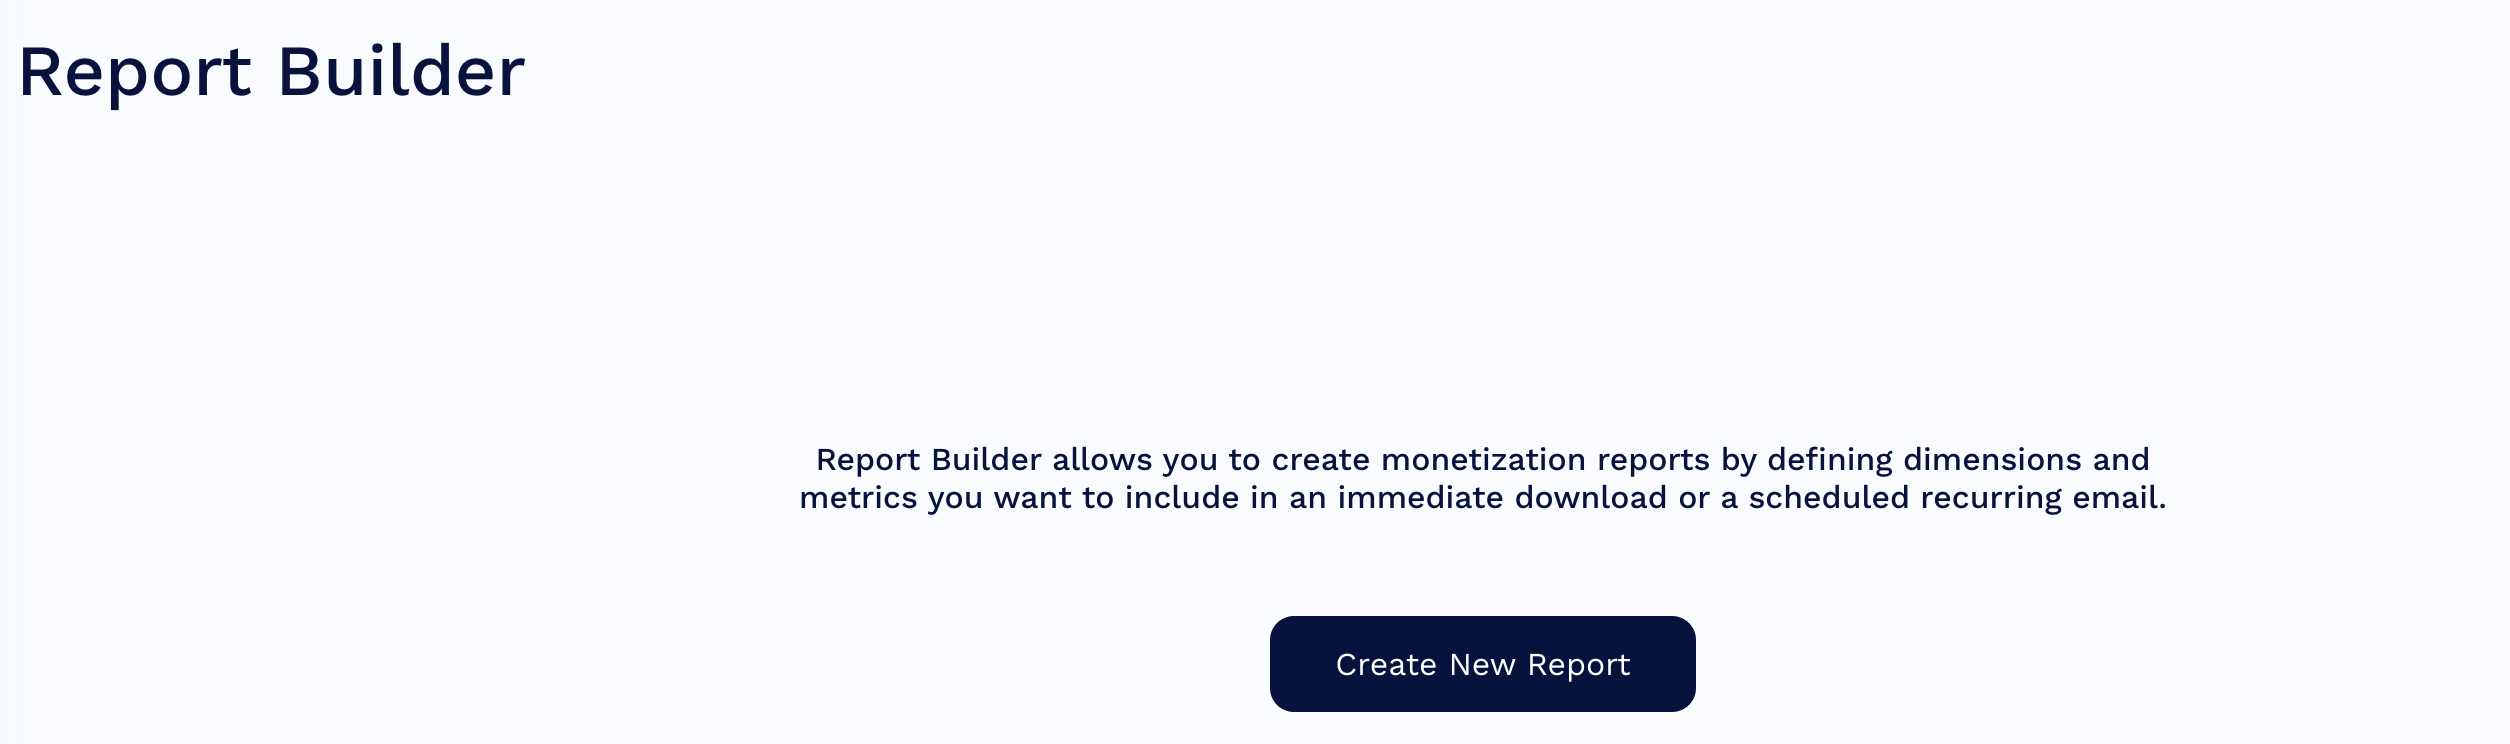
If there are no saved custom reports as user clicks Report Builder, then they can click the Create New Report button to start the process to create a new custom report
Creating a New Report
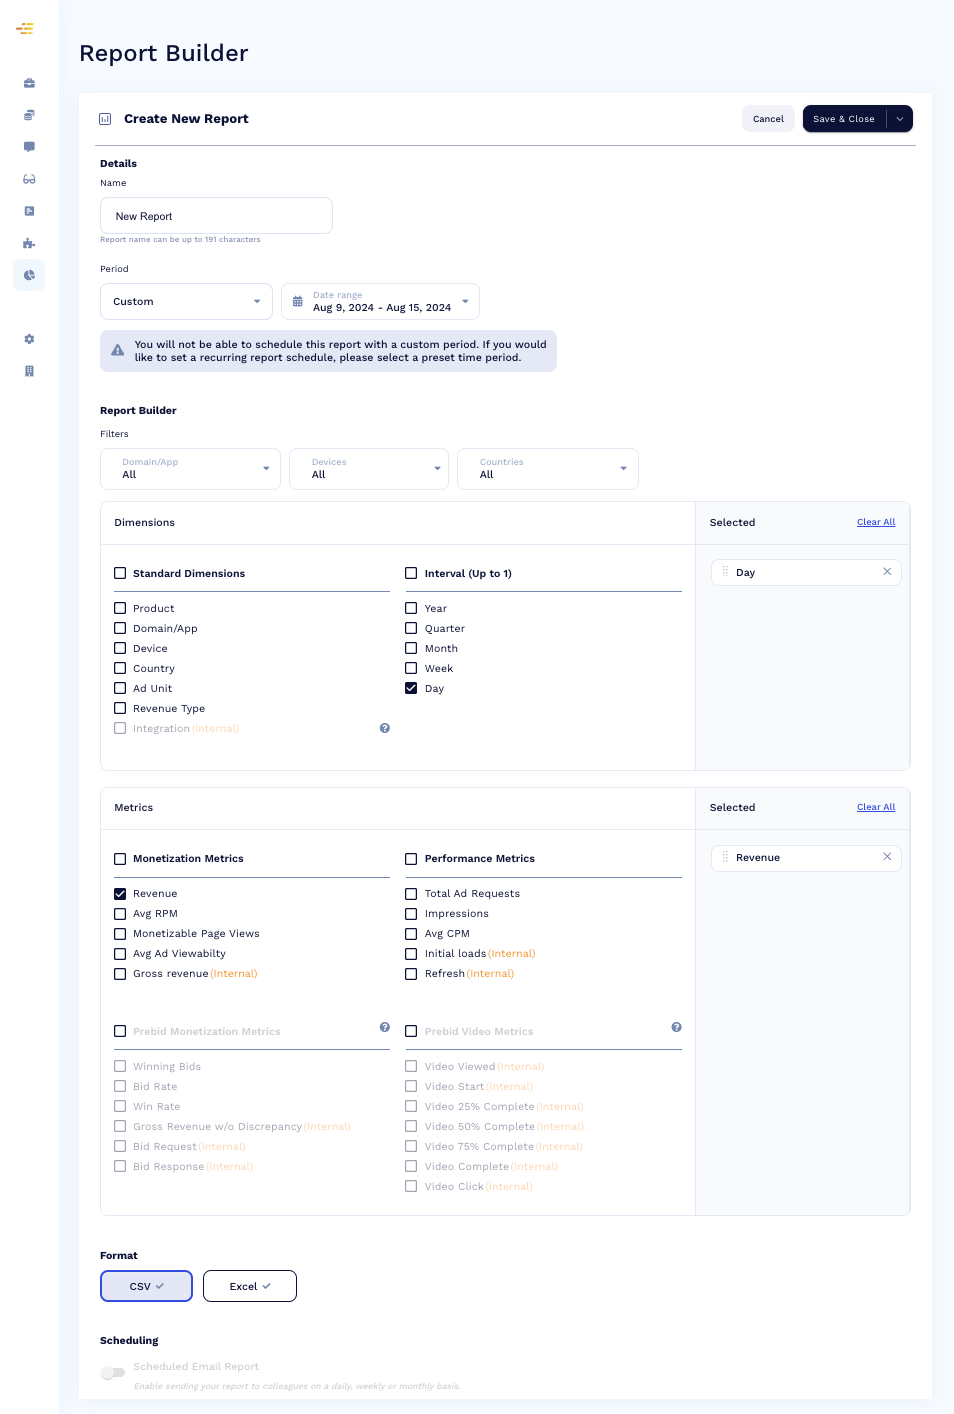
Below is view as the Create New Report button is clicked. This same view will be available as the user clicks the Edit button for an existing custom report.
This process allows the creation of a desired report only once and then have updated data sent at a defined frequency.
Creating a new report page
Report Configuration - Name & Filters
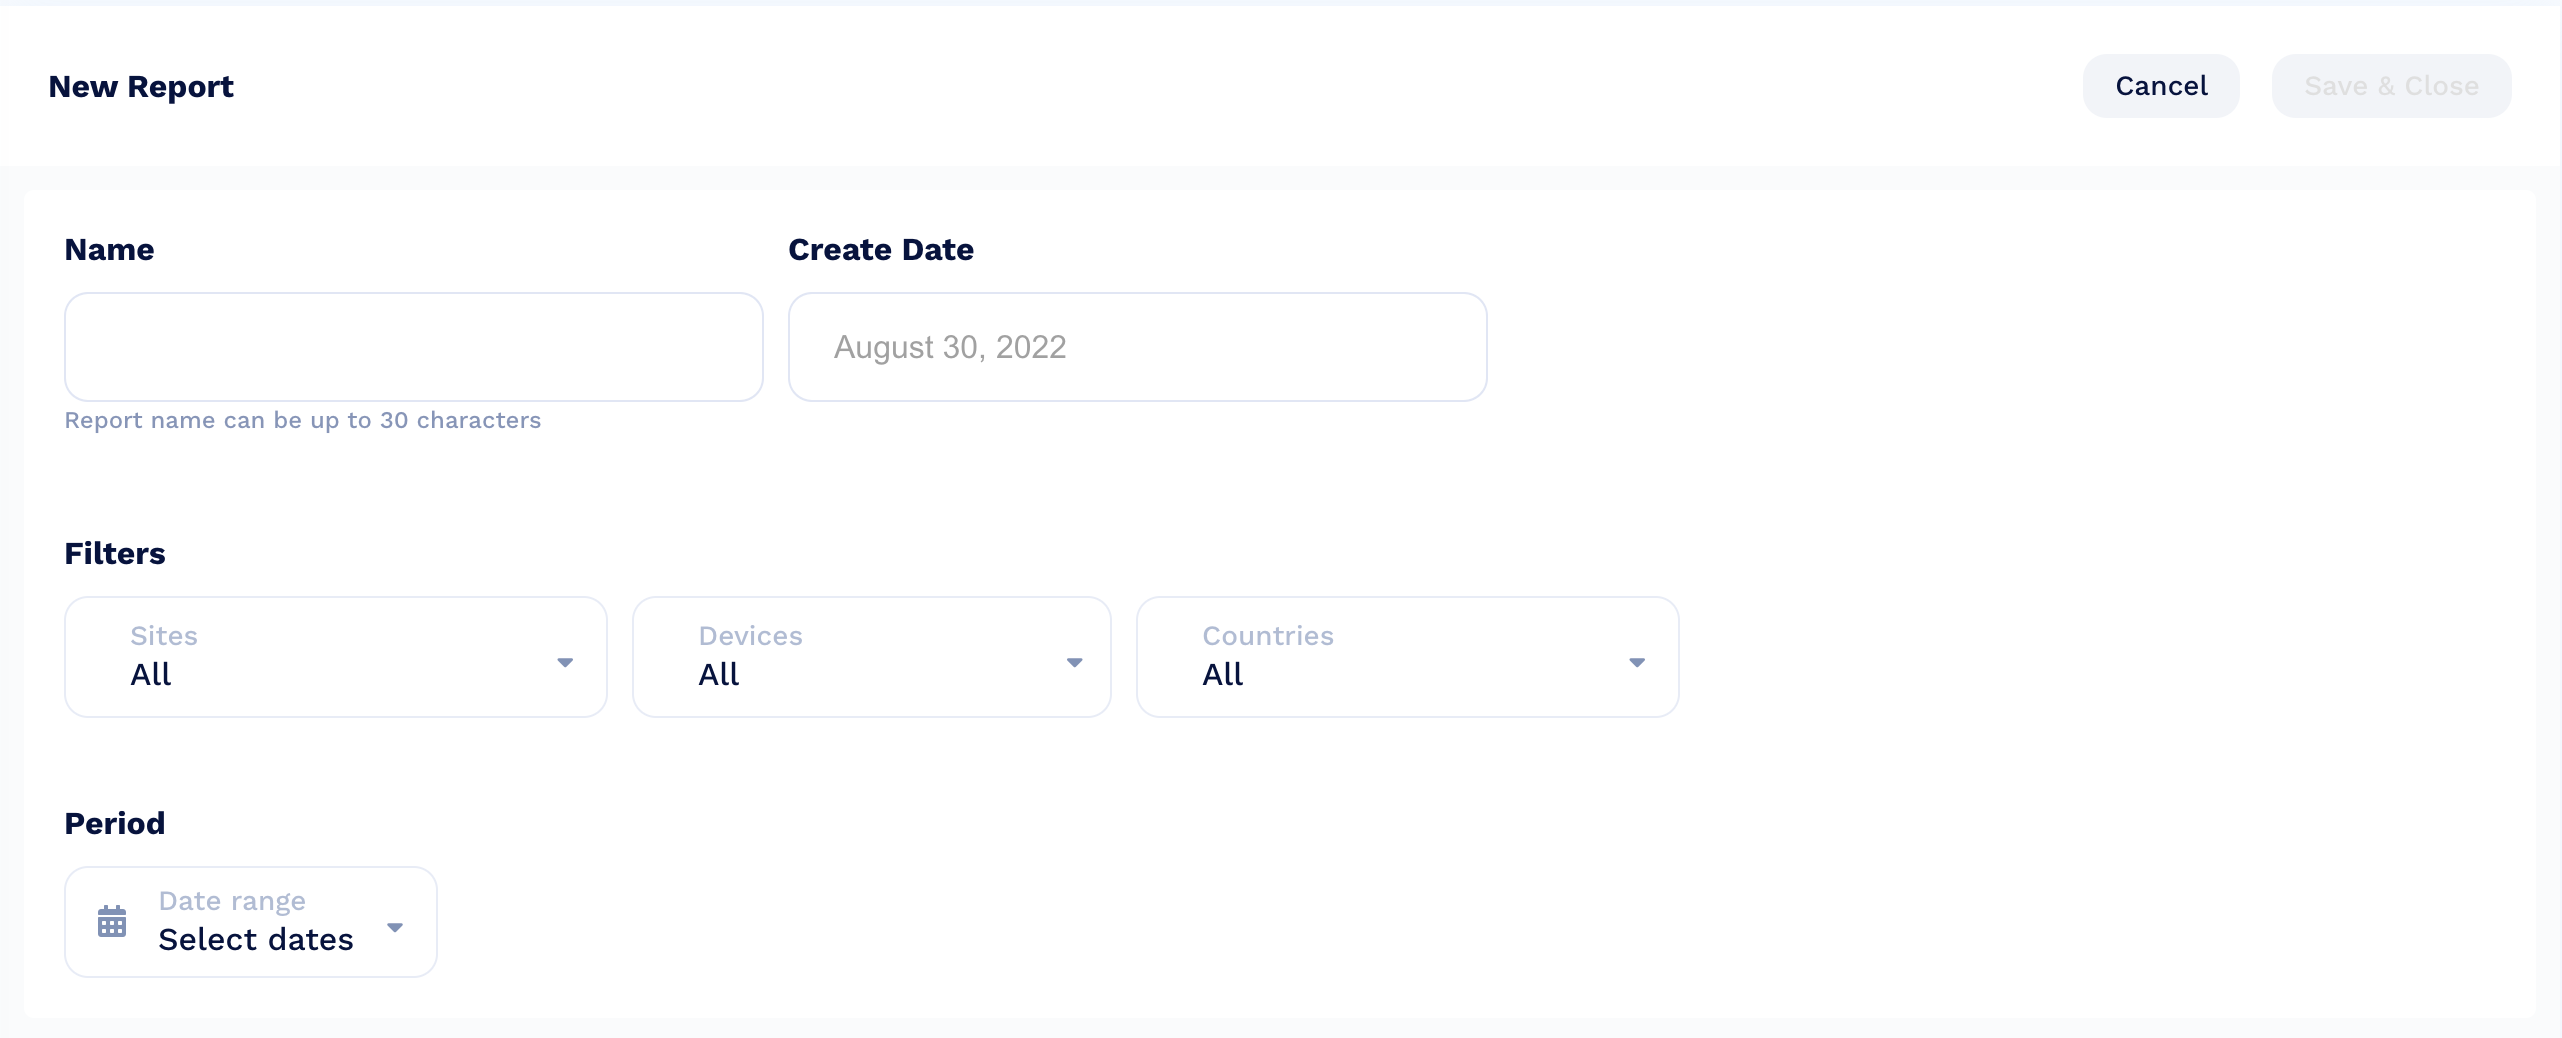
When creating a new custom report, you will be able to save it and have it automatically send you updated data at your defined frequency.
- Name - choose a unique name of your report. This name will show up on the Report Builder list as described above. This name can't be more than 30 characters. You may want to pick a name that includes the metrics, frequency, target audience, etc to make it easier to identify.
- Create Date - this date is populated automatically and cannot be changed. It reflects the date the report was created
- Filters - By default, the filters will reflect the values of Global Filters at the top of the page. We've done this to make it easy to create and/or download a custom report from an insight that found. However, these Filters can be changed and apply only to the custom report that is being created. So, for example, if only Mobile is seclected on the Devices filter then the data that is downloads or sent will only contain Mobile data.
- Period - The period calendar will also reflect the date rage of the Global Filter. This too can be changed for the new custom report.
- NOTE: As a new recurring report is created, the timeframe should not have a defined start and end date as that will limit the data set and not be updated over time. Therefore if you want a recurring email to be sent over time, select date filters like Last Week, This Month, Year to Date, etc.
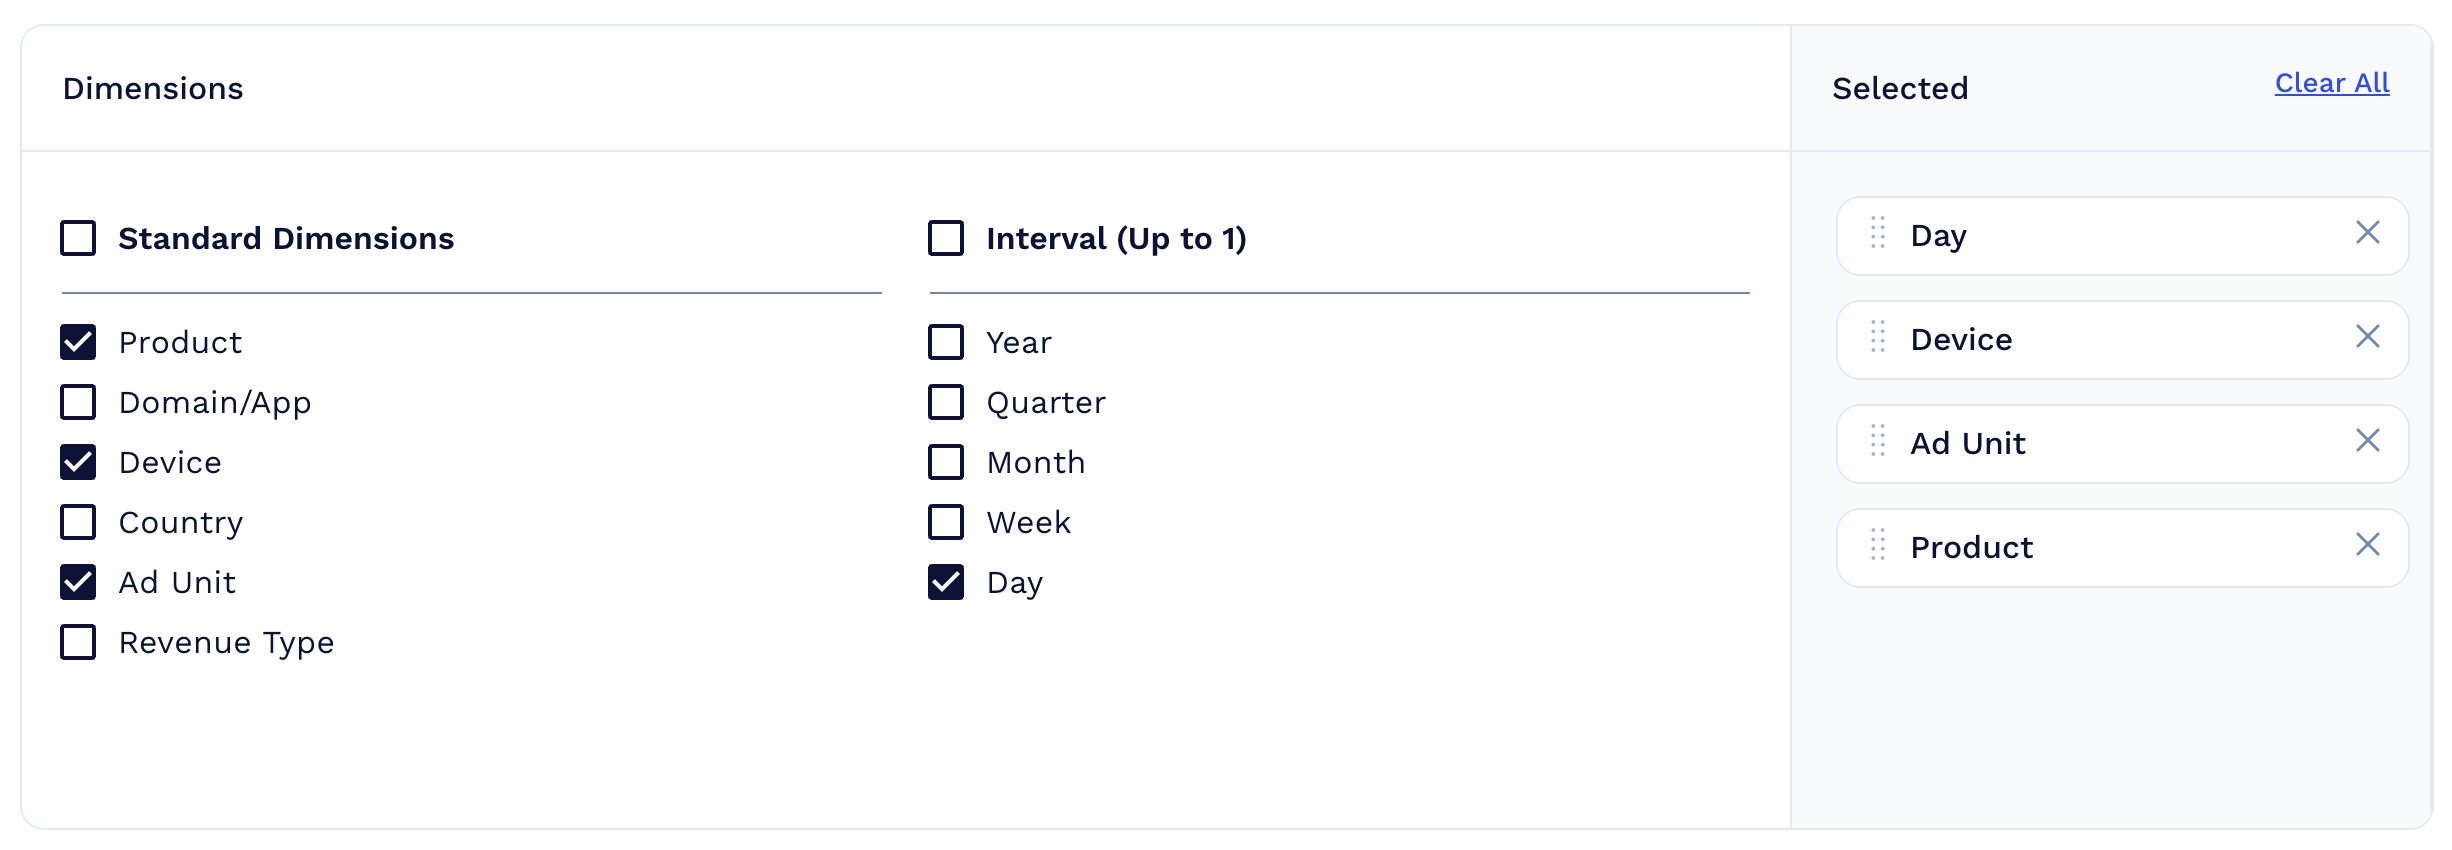
Dimensions
The Dimensions make up how many rows of data will exist within the spreadsheet. A minimum of one must be selected.
- The order of dimensions for the columns can be defined by the user. By clicking the dots to the left of the dimension, the value can be dragged into a custom order on the right-side panel.
- The Dimension values will come first followed by Monetization Metrics for each row.
- The Day, Week, Month, Quarter, and Year are each individual columns. This will make it easy to create pivot tables and to more easily group data.
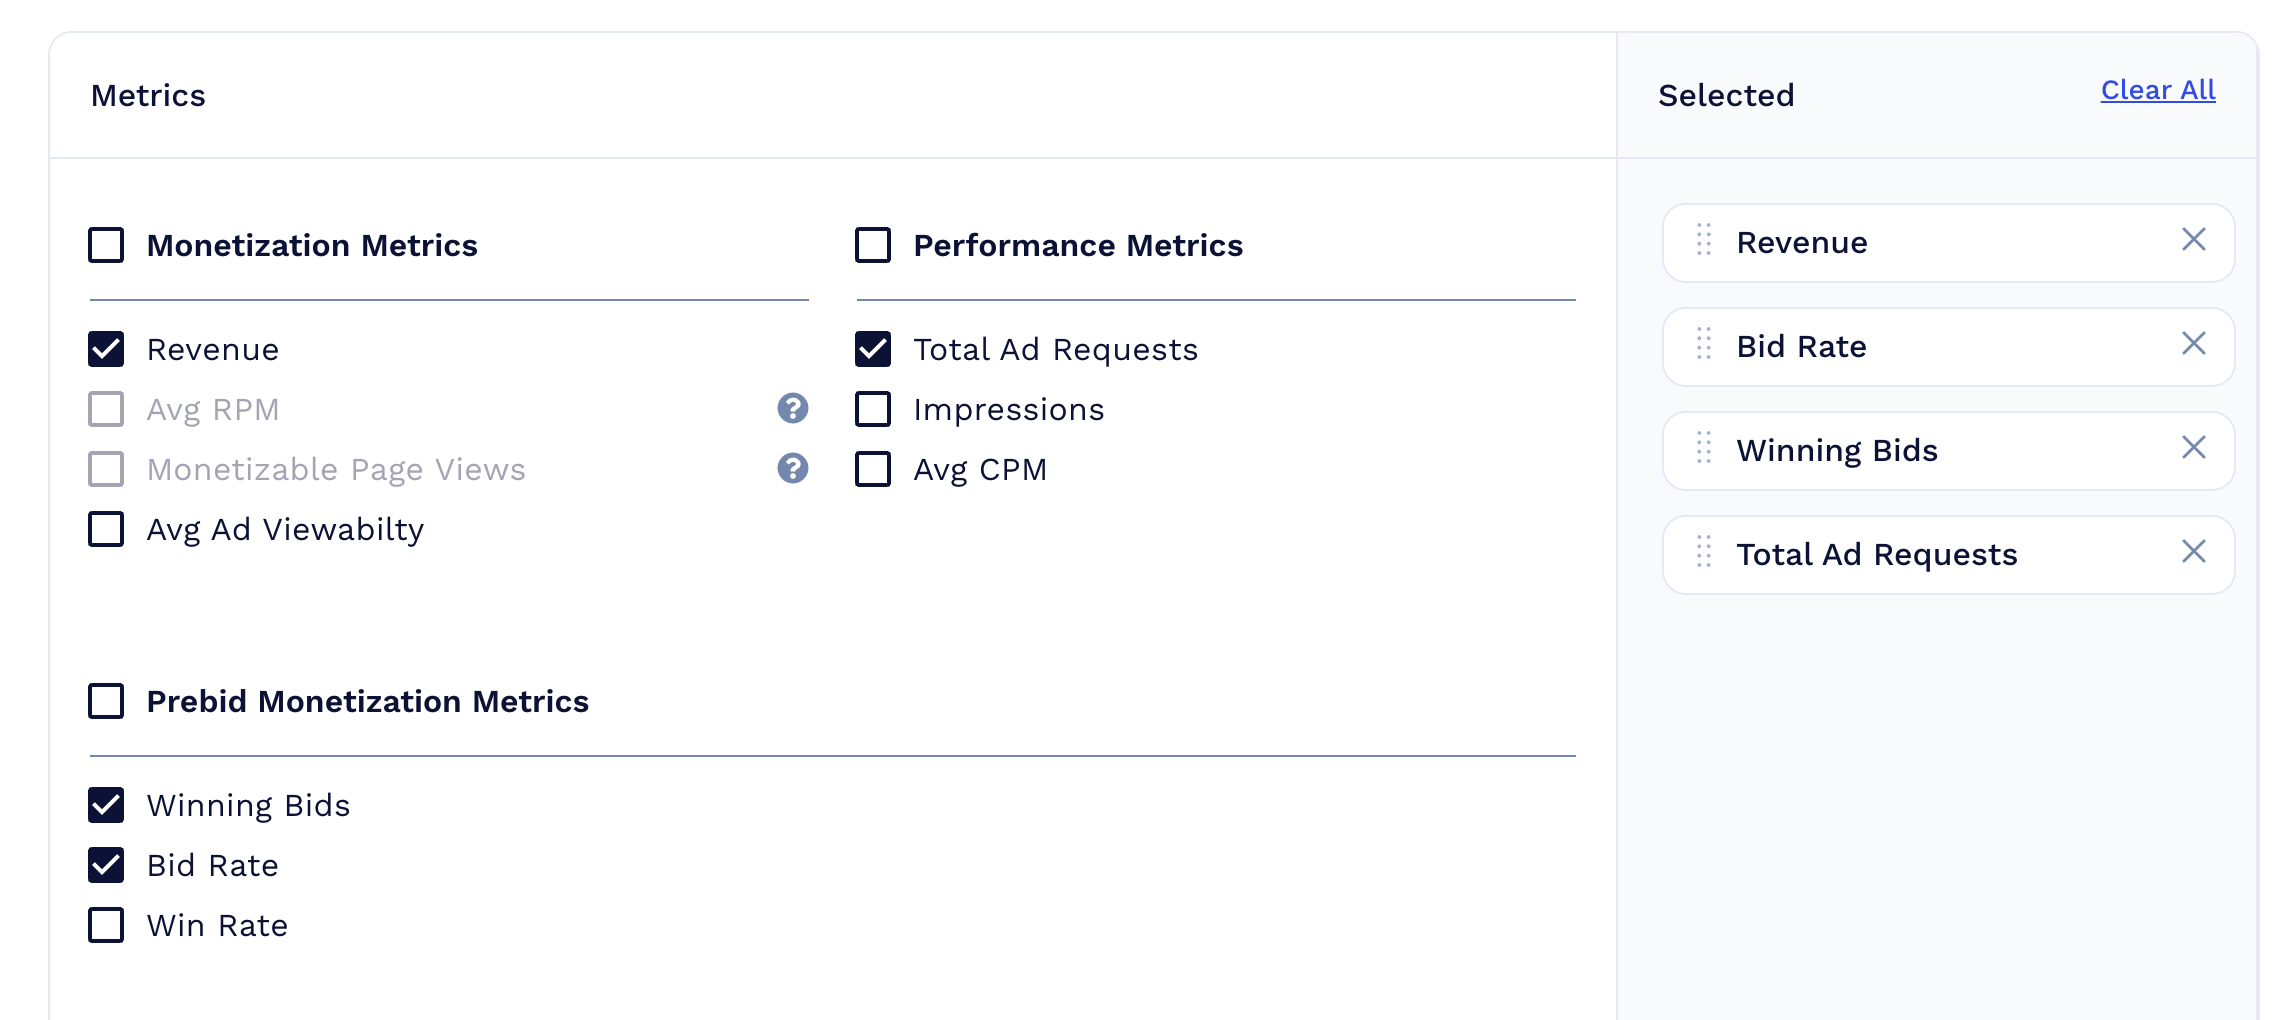
Monetization Metrics
The Monetization Metrics make up the columns within the spreadsheet. This is the revenue data broken up by the selected dimensions. At least one must be selected.
- The order of the rows can be defined by the user. By clicking the dots to the left of the dimension, the value can be dragged into a custom order.
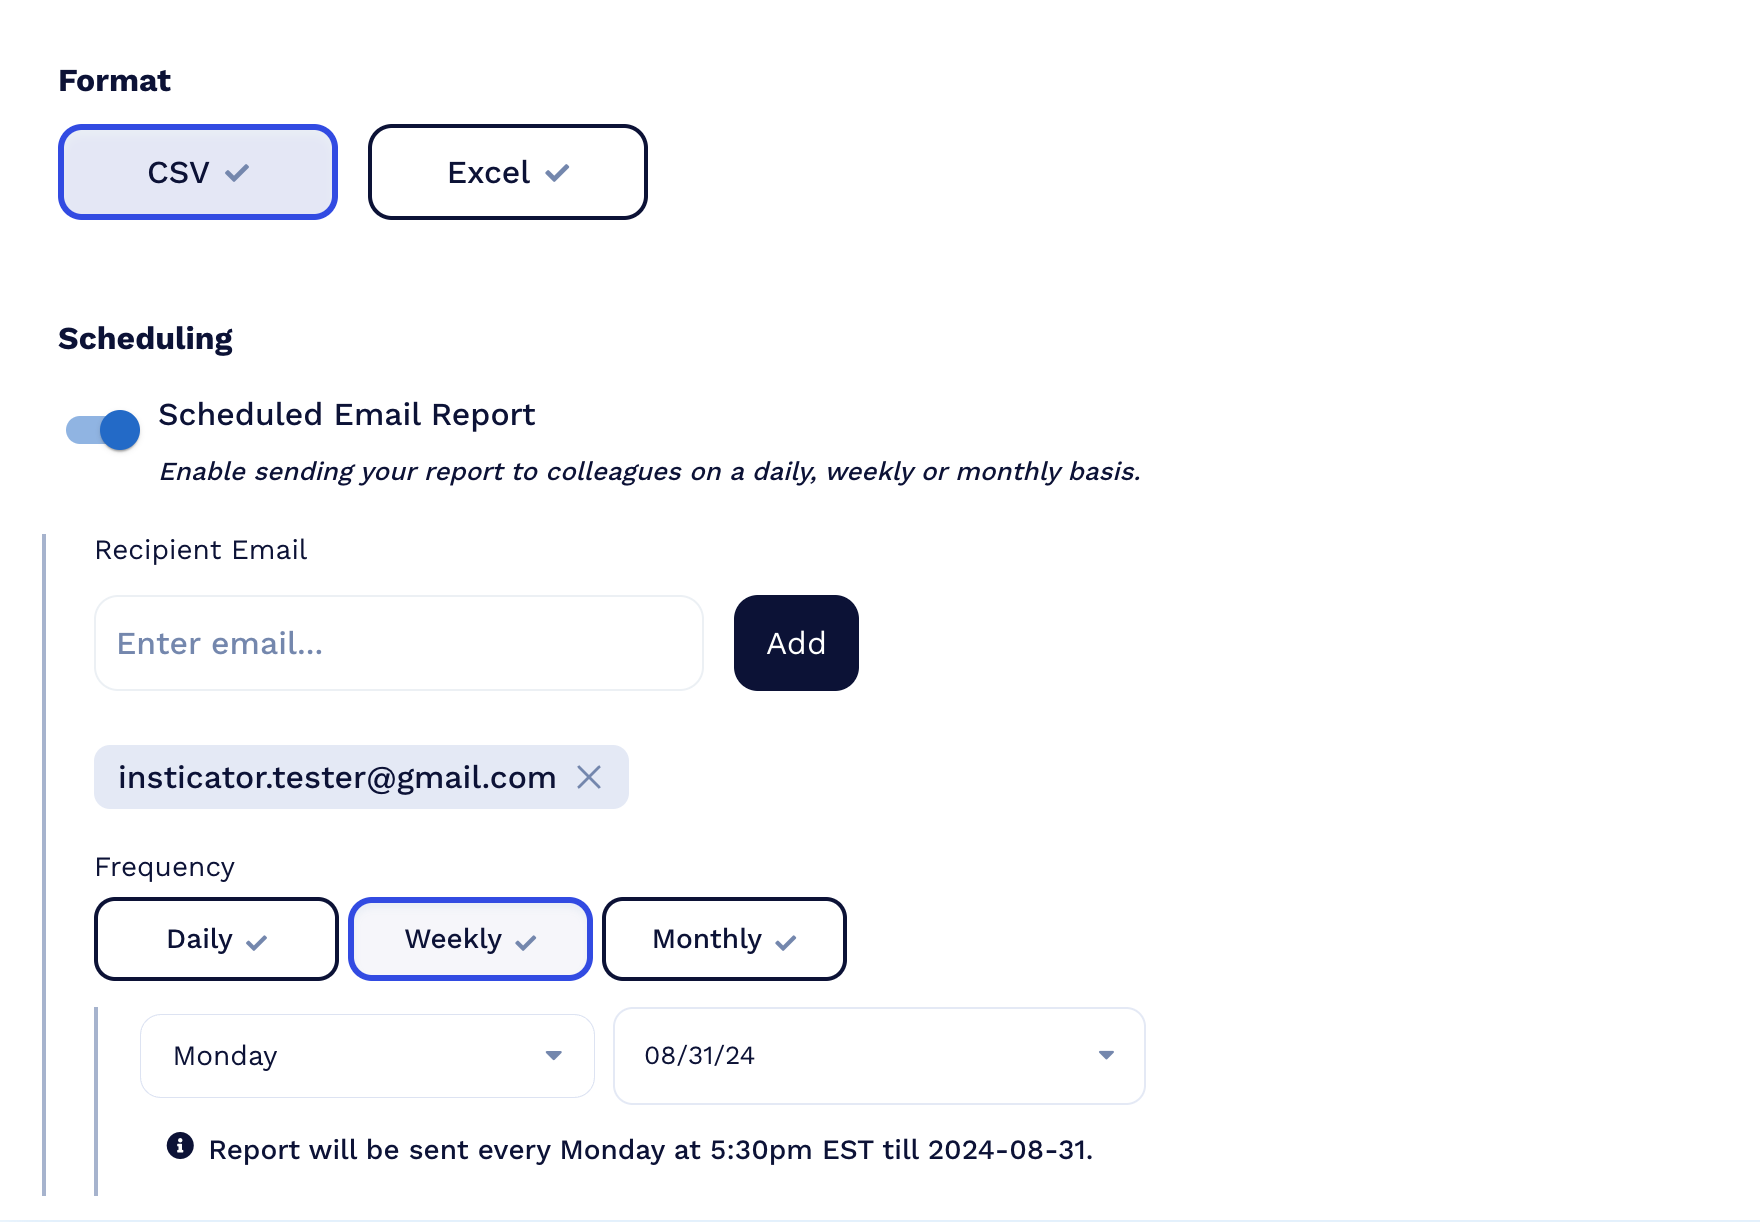
Scheduled Email Reports
As a report is created, it can be downloaded immediately as a one-time event or it can be setup to be sent via a recurring email at a specified frequency.
- To configured a recurring email to be sent, toggle the Scheduled Email Report to on which will then expand the configuration view
- Send report to - at least one email address needs to be added before being saved. The user can add multiple email addresses by simply clicking on the the Add a new address button. Email addresses can also be removed by clicking on the Delete icon
- Frequency - this defines how frequently the spreadsheet will be sent via an email attachment
- Daily - an email will be sent everyday at the same time with data for the previous day. The calendar filter below it will set the End Date
- Weekly - the user will receive the data once a week and define the day they want it sent
- Monthly - the user will receive the data first day of the month
Updated 8 months ago